
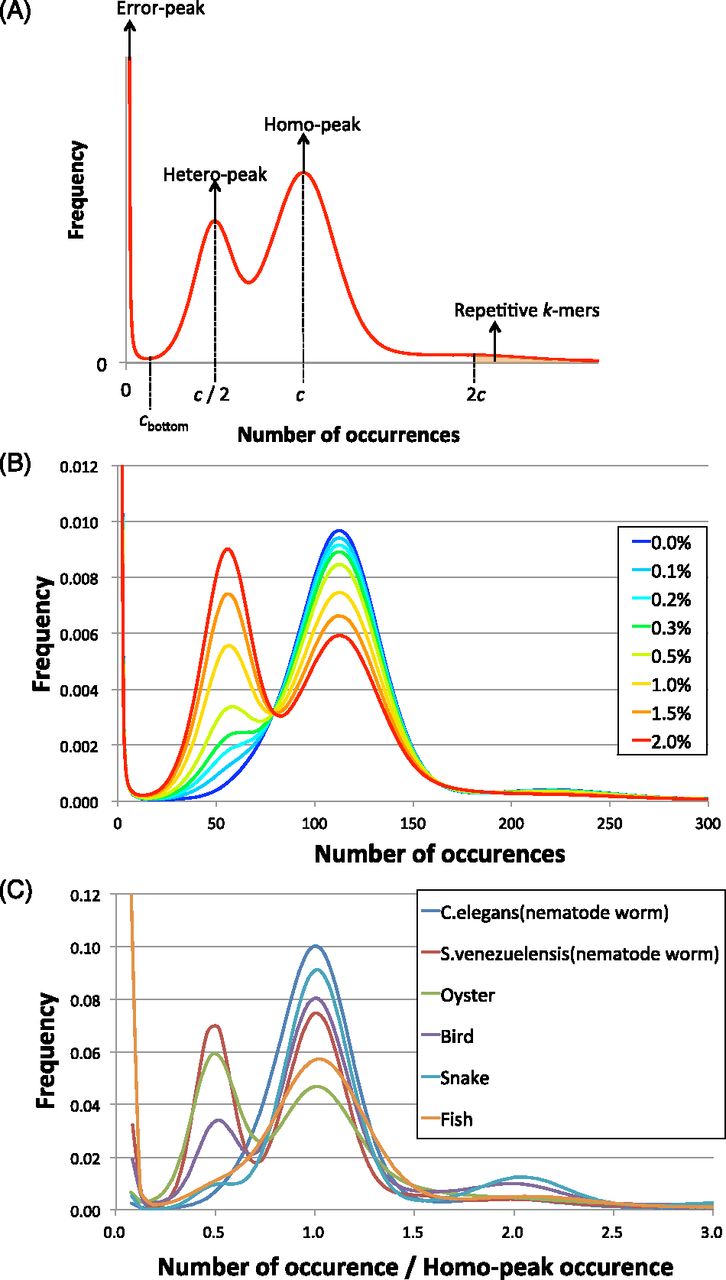
Figure 2.
Distribution of the number of 17-mer occurrences. (A) Schematic model of the distribution of k-mer occurrences. This distribution is related to that shown in Table 1. (B) Simulated heterozygous data from C. elegans. (C) Distributions of normalized 17-mer occurrences for all species.


