
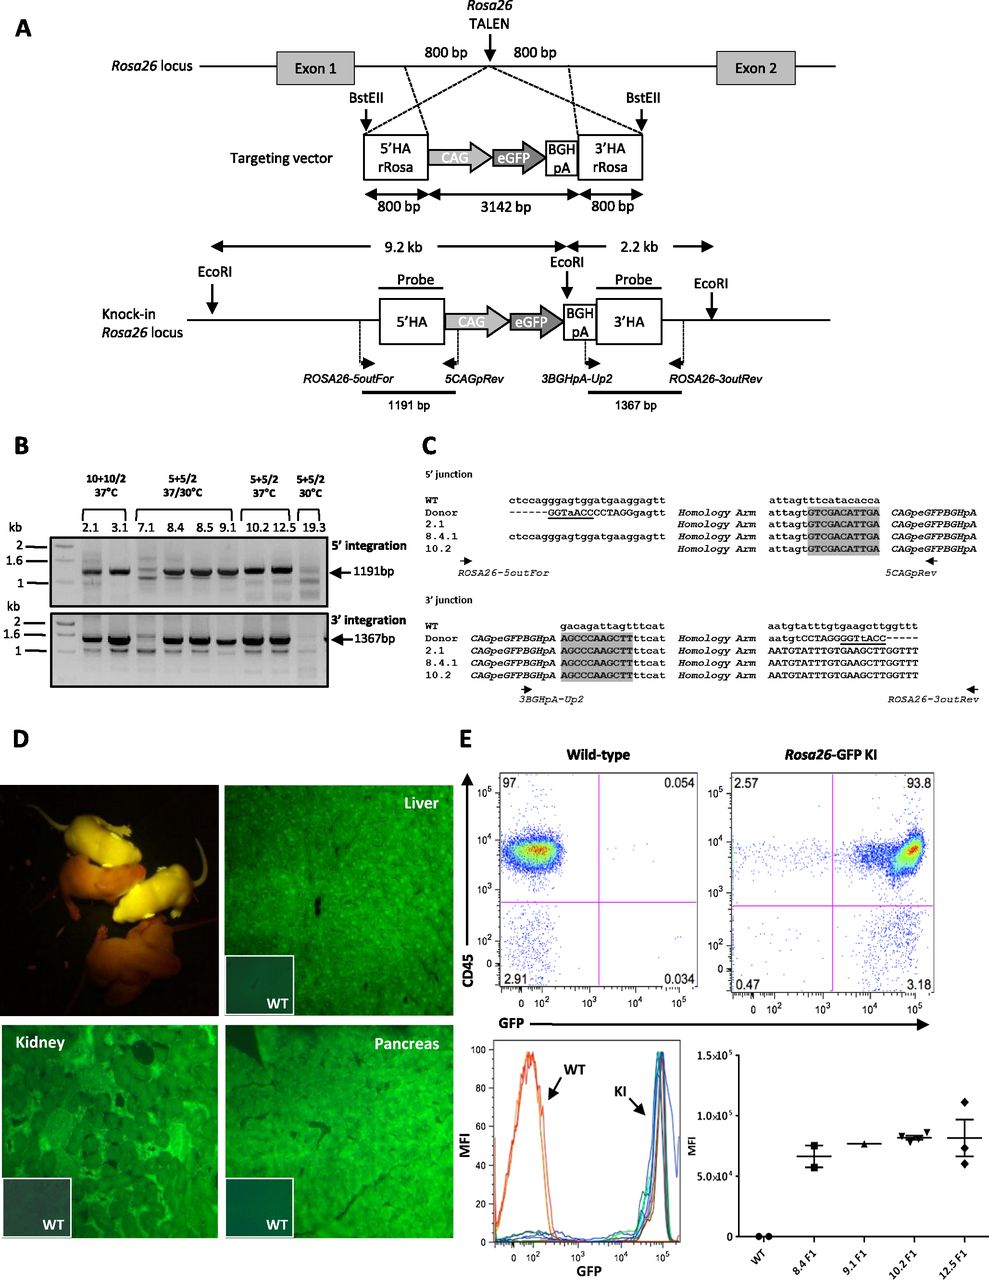
Targeted integration of a GFP cassette into the Rosa26 locus. (A) (Upper) Diagram showing schematic representation of the rat Rosa26 locus, with the site of TALE nuclease action (vertical arrows) and of the targeting vector with the expression cassette (3142 bp) and the 5′ and 3′ homology arms (800 bp each). The homology arms are contiguous to the TALE nucleases’ cleavage point. BstEII restriction sites are indicated. (A) (Lower) Diagram showing schematic representation of the GFP cassette integration. For PCR in/out analysis, genomic DNAs were PCR-amplified with primers situated for the 5′ side: upstream of the 5′ HA arm (ROSA26-5outFor) and in the CAG promoter (5CAGpRev); and for the 3′ side: in the BGHpA (3BGHpA-Up2) and downstream from the 3′ HA arm (ROSA26-3out Rev). The position of each primer and the corresponding expected size of PCR products are indicated on the schematic knock-in Rosa26 locus. For Southern blot analysis, genomic DNA was digested with EcoRI and was probed with the homology arms’ probe for Rosa26. Two bands at 9.2 kb and 2.2 kb are predicted for a correct HDR into the Rosa26 locus. (B) Flanking PCR analysis. Gels show the results analyzing the 5′ and the 3′ extremities of the expression cassette integration into the Rosa26 locus. A representative panel of nine founders is illustrated, showing expected bands of 1191 bp using the first pair of primers (ROSA26-5outFor + 5CAGpRev), and of 1367 bp using the second pair of primers (3BGHpA-Up2 + ROSA26-3outRev). The microinjection conditions in terms of mRNA and DNA concentrations as well as embryo incubation temperatures are above each animal. (C) Sequence comparison at the 5′ and 3′ junctions with wild-type genomic DNA and donor DNA sequences of two representative founders (2.1 and 10.2) and one representative F1 (8.4.1: offspring of founder 8.4). In donor DNA, the presence of the BstEII site is indicated (underlined). The start and the end of the expression cassette are colored in gray. (D) Two representative 8-d-old Rosa26 HDR rat pups (F1s of founder 8.4) and two wild-type littermates. GFP expression in adult tissues (liver, kidney, pancreas) of a Rosa26 HDR rat. Insets show tissues obtained from littermates negative for GFP PCR (wild type, WT). Magnification: ×100. (E) GFP expression in leukocytes from different lines of Rosa26 HDR rats. FACS analysis of GFP expression in CD45+ leukocytes isolated from peripheral blood from four different lines of Rosa26 HDR adult rats (F1generation) and a wild-type littermate. (Upper) FACS patterns obtained from two F1 (an HDR GFP+ and a negative littermate) of founder 8.4. (Lower) Analysis of the level of GFP expression in the peripheral blood of offspring of four Rosa26 HDR founders using the mean fluorescence intensity of leukocytes. Each point represents one animal and the horizontal bars the mean and standard deviations.


