
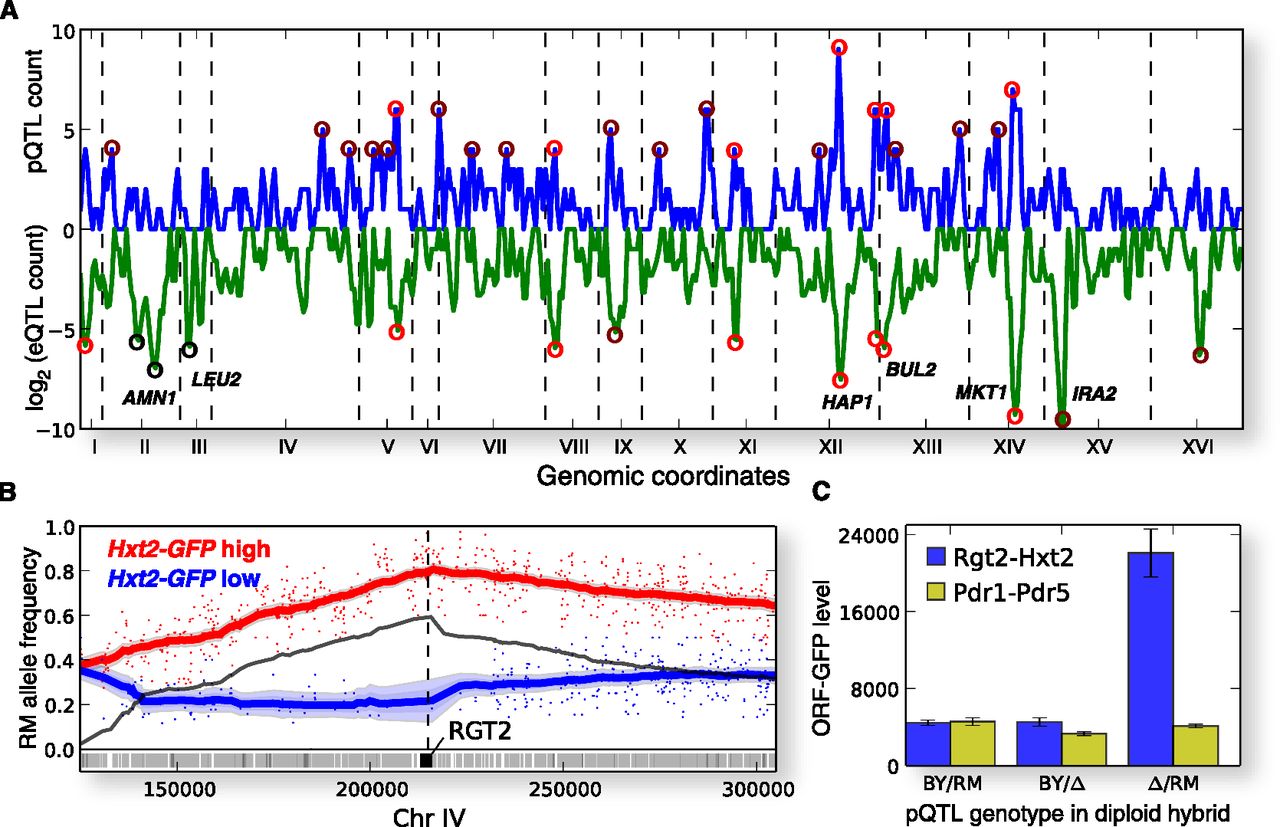
Protein level QTLs. (A) Genome-wide density of pQTLs and eQTLs. Number of pQTLs (y-axis, linear scale, positive), and eQTLs (y-axis, log2 scale, negative) in 50% overlapping 25-kb bins along the genome (x-axis). eQTL peaks with at least 30 linkages, and pQTL peaks with at least four pQTLs are highlighted with either bright red markers (peak present for both pQTLs and eQTLs), dark red markers (peak present for pQTLs or eQTLs, but not both), or black markers (eQTL peaks due to alleles not segregating in our cross). Known QTL hotspots are marked with the causal gene. (B) Chromosome IV QTL for Hxt2-GFP abundance overlapping the RGT2 locus. The allele frequencies (y-axis) in the GFP high pool (red) and GFP low pool (blue) along a 200-kb region of chromosome IV (x-axis). Each dot corresponds to one segregating site between the BY and RM parents, with its y-coordinate equal to the fraction of sequencing reads with the RM allele mapped to the site. Solid lines correspond to window-averaging of the dots and approximate the underlying population allele frequency, with the 5% confidence intervals given by shaded regions. The estimated difference between the RM allele frequencies in the GFP high and low pools is overlaid with a solid black line, and the local allele frequency difference maximum with a dashed black vertical line. Yeast genes in the region are displayed below the allele frequencies as rectangles, with the RGT2 gene highlighted. (C) RGT2RM (blue) and PDR1RM (yellow) are causal alleles for Hxt2 and Pdr5 protein level differences, respectively, by reciprocal hemizygosity. Two independent clones were measured in triplicate for the BY × RM hybrid (left), the same hybrid with the BY allele deleted (middle), and the RM allele deleted (right).


