
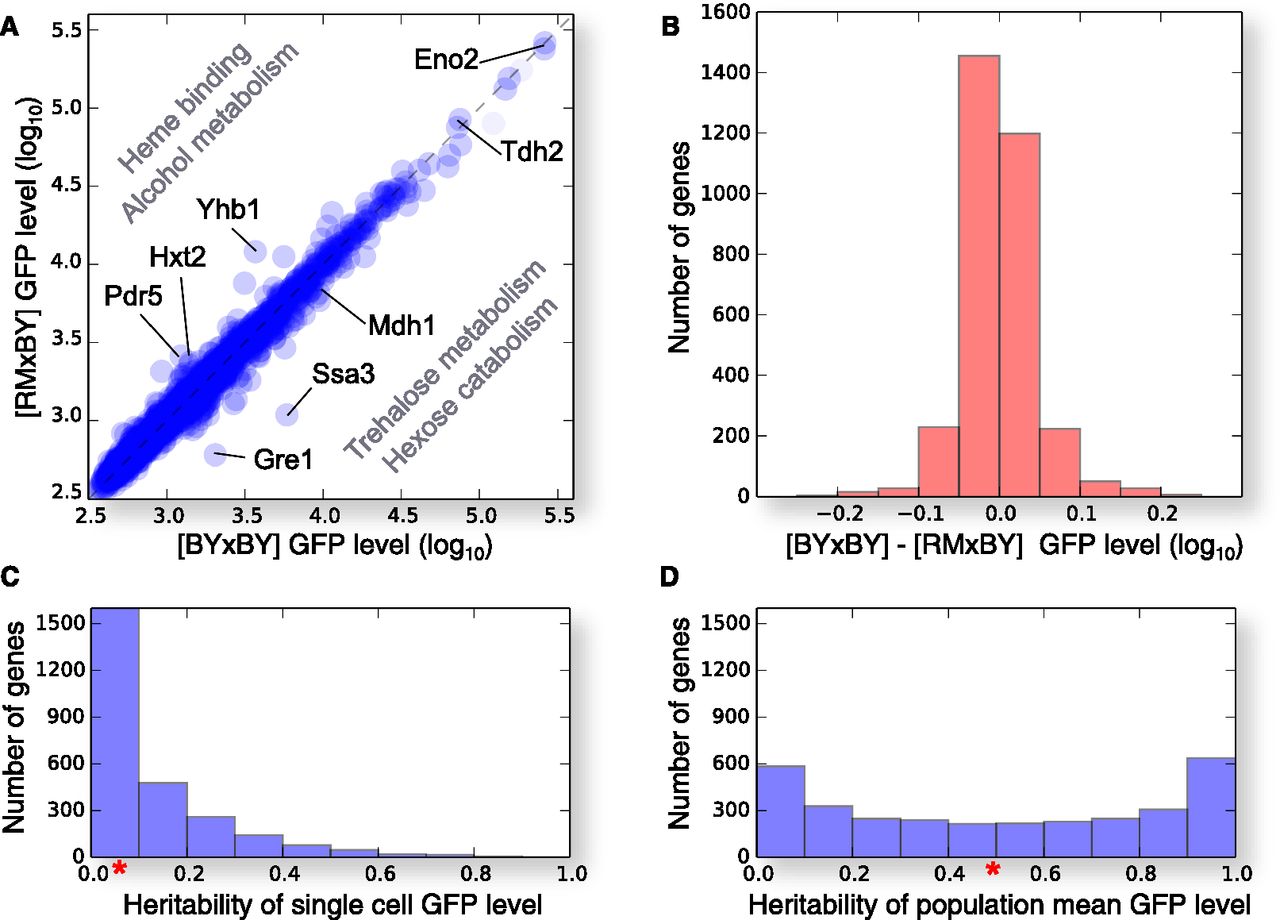
Genetic contribution to protein levels via trans variants. (A) Protein levels are similar in the inbred BY × BY and segregating RM × BY populations. Average protein level for the inbred BY × BY individuals (x-axis, log10 scale) and BY × RM segregants (y-axis, log10 scale) for 3173 genes (blue dots). Individual examples of genes with a large difference between inbred and outbred progeny, and genes discussed in the text are highlighted. (B) The distribution of differences in GFP level between inbred and outbred populations is tightly centered on zero. The effect of 0.1 on the log10 scale corresponds approximately to a difference of 25%. (C) Single-cell protein level heritabilities are low. Distribution of broad sense heritability (x-axis), calculated as the fraction of total variation explained by genotype in the pooled population of inbred BY × BY and outbred RM × BY segregants, assuming 50% contribution from both. Median heritability across genes is marked with a red asterisk. (D) Population average protein level heritabilities are high. Distribution of broad sense heritability (x-axis), calculated as the average squared difference of mean protein level between inbred BY × BY individuals and RM × BY segregants and the total variation in average protein level across replicates and populations. Median heritability across genes is marked with a red asterisk.


