
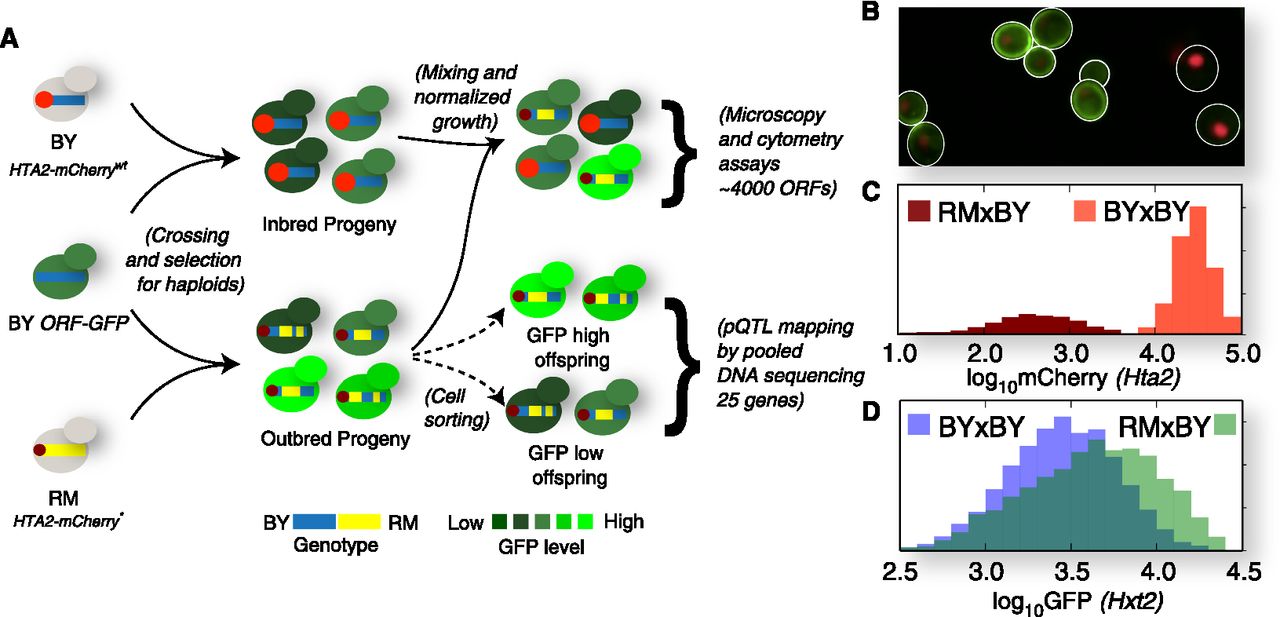
Overview of the experiment. (A) Experimental design. The GFP collection strains are crossed to near-isogenic (BY) and genetically diverged (RM) parental strains, the progeny measured using two assays, and sorted for pQTL mapping. (B) Section of an example microscopy image. Hxt2-GFP signal is shown in green and nuclear Hta2-mCherry signal in red; white outlines designate the cell boundaries. (C) Classifying cells into BY × BY inbred progeny and RM × BY segregants. The mCherry fluorescence (x-axis, log10 scale) of the RM parent (mCherry*, dark red) is on average ∼100-fold lower than that of the BY parent (mCherry wild type, bright red), and is used to classify cells into RM × BY or BY × BY cross progeny. (D) Example cytometry readout. Hxt2-GFP level (x-axis, log10 scale) is measured for tens of thousands of individual cells from the inbred BY × BY population (blue) and segregating RM × BY population (green), and used to calculate the summary statistics of the Hxt2 protein level.


