
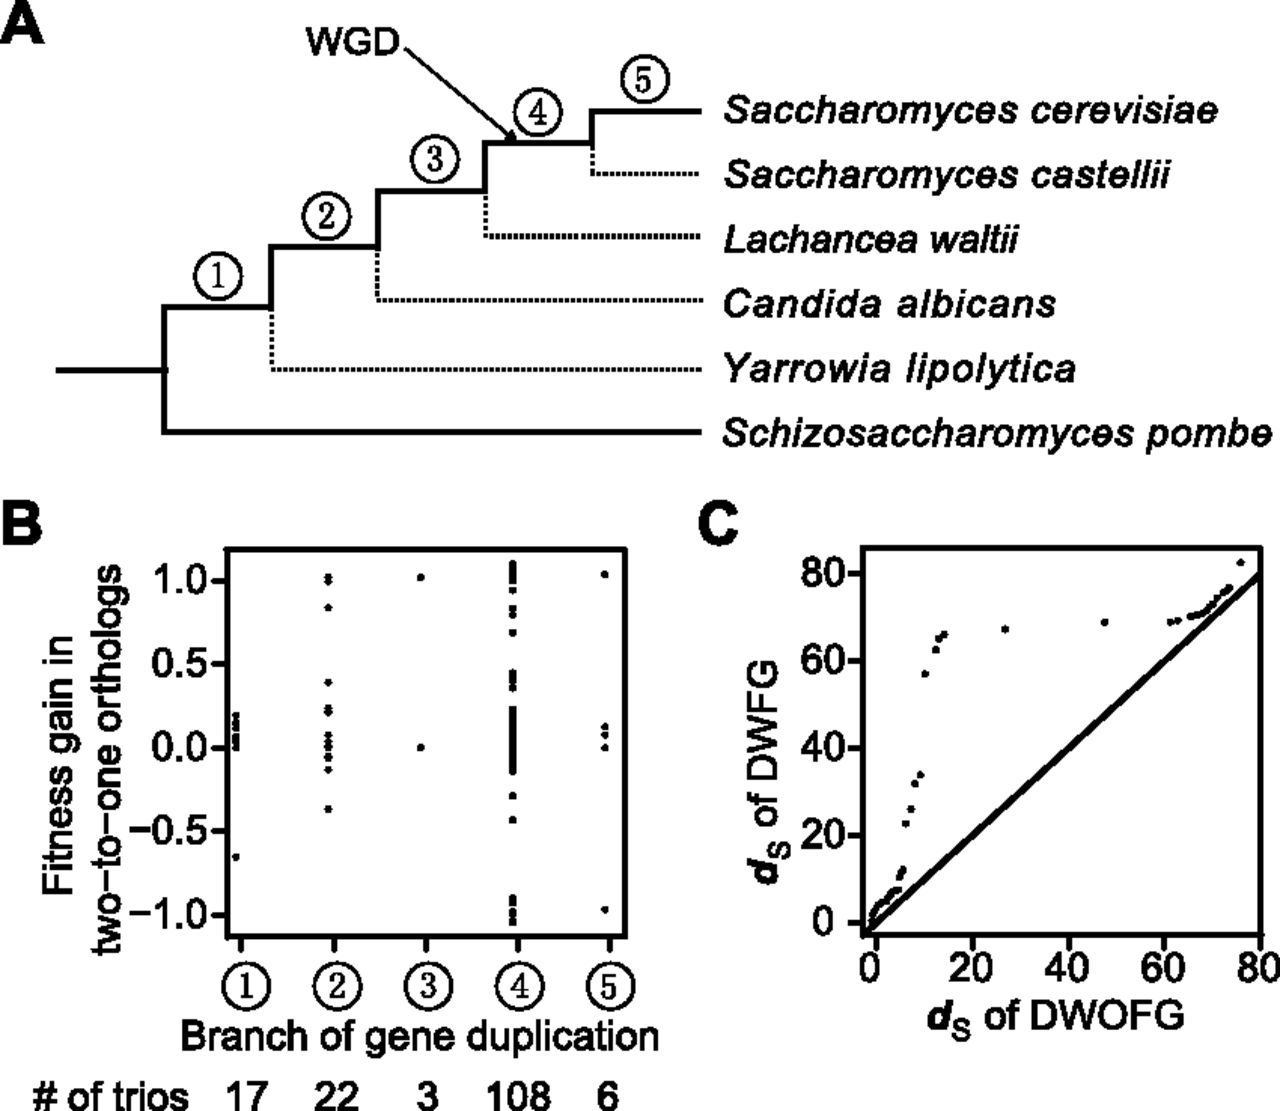
Gene duplication-associated adaptation tends to occur in duplicates with higher synonymous distances (dS). (A) A phylogeny of fungi allowing the separation of S. cerevisiae duplicates into five age groups. WGD indicates the timing of a known whole-genome duplication that occurred in the budding yeast lineage. (B) Fitness gain (shown by the y-axis of Fig. 1F) in two-to-one orthologs is independent of the phylogenetic timing of the duplication (Pearson’s correlation r = 0.03, P = 0.71; Spearman’s rank correlation ρ = 0.01, P = 0.91). Each dot represents a two-to-one trio. (C) Quantile–quantile plot of dS between S. cerevisiae duplicates of the DWFG group and that of the DWOFG group (P = 0.05, one-tail Kolmogorov-Smirnov test; P = 0.01, one-tail Mann-Whitney U test).


