
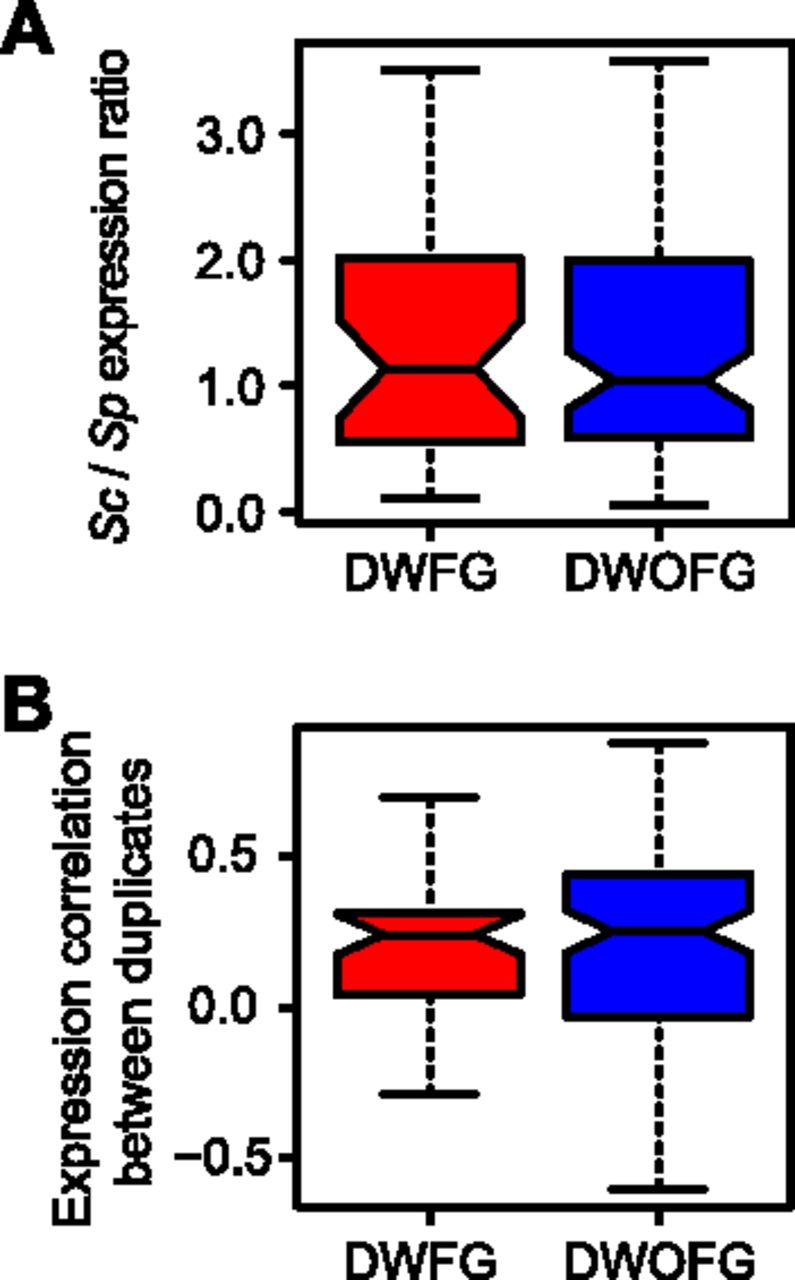
Comparison of gene expressions between duplicates with (DWFG) and without (DWOFG) fitness gains. (A) The ratio between the total expression level of a pair of S. cerevisiae (Sc) duplicates and the expression level of their S. pombe (Sp) ortholog is similar between DWFG and DWOFG (P = 0.79, two-tail Mann-Whitney U test). (B) Expression-level correlation between Sc paralogs across conditions and biological processes is similar between DWFG and DWOFG (P = 0.42, two-tail Mann-Whitney U test). In both panels, the bottom and top of each box are the first and third quartiles, and the band inside the box shows the median. The whiskers extend to the most extreme data within 1.5 times the interquartile range below the first quartile and above the third quartile.


