
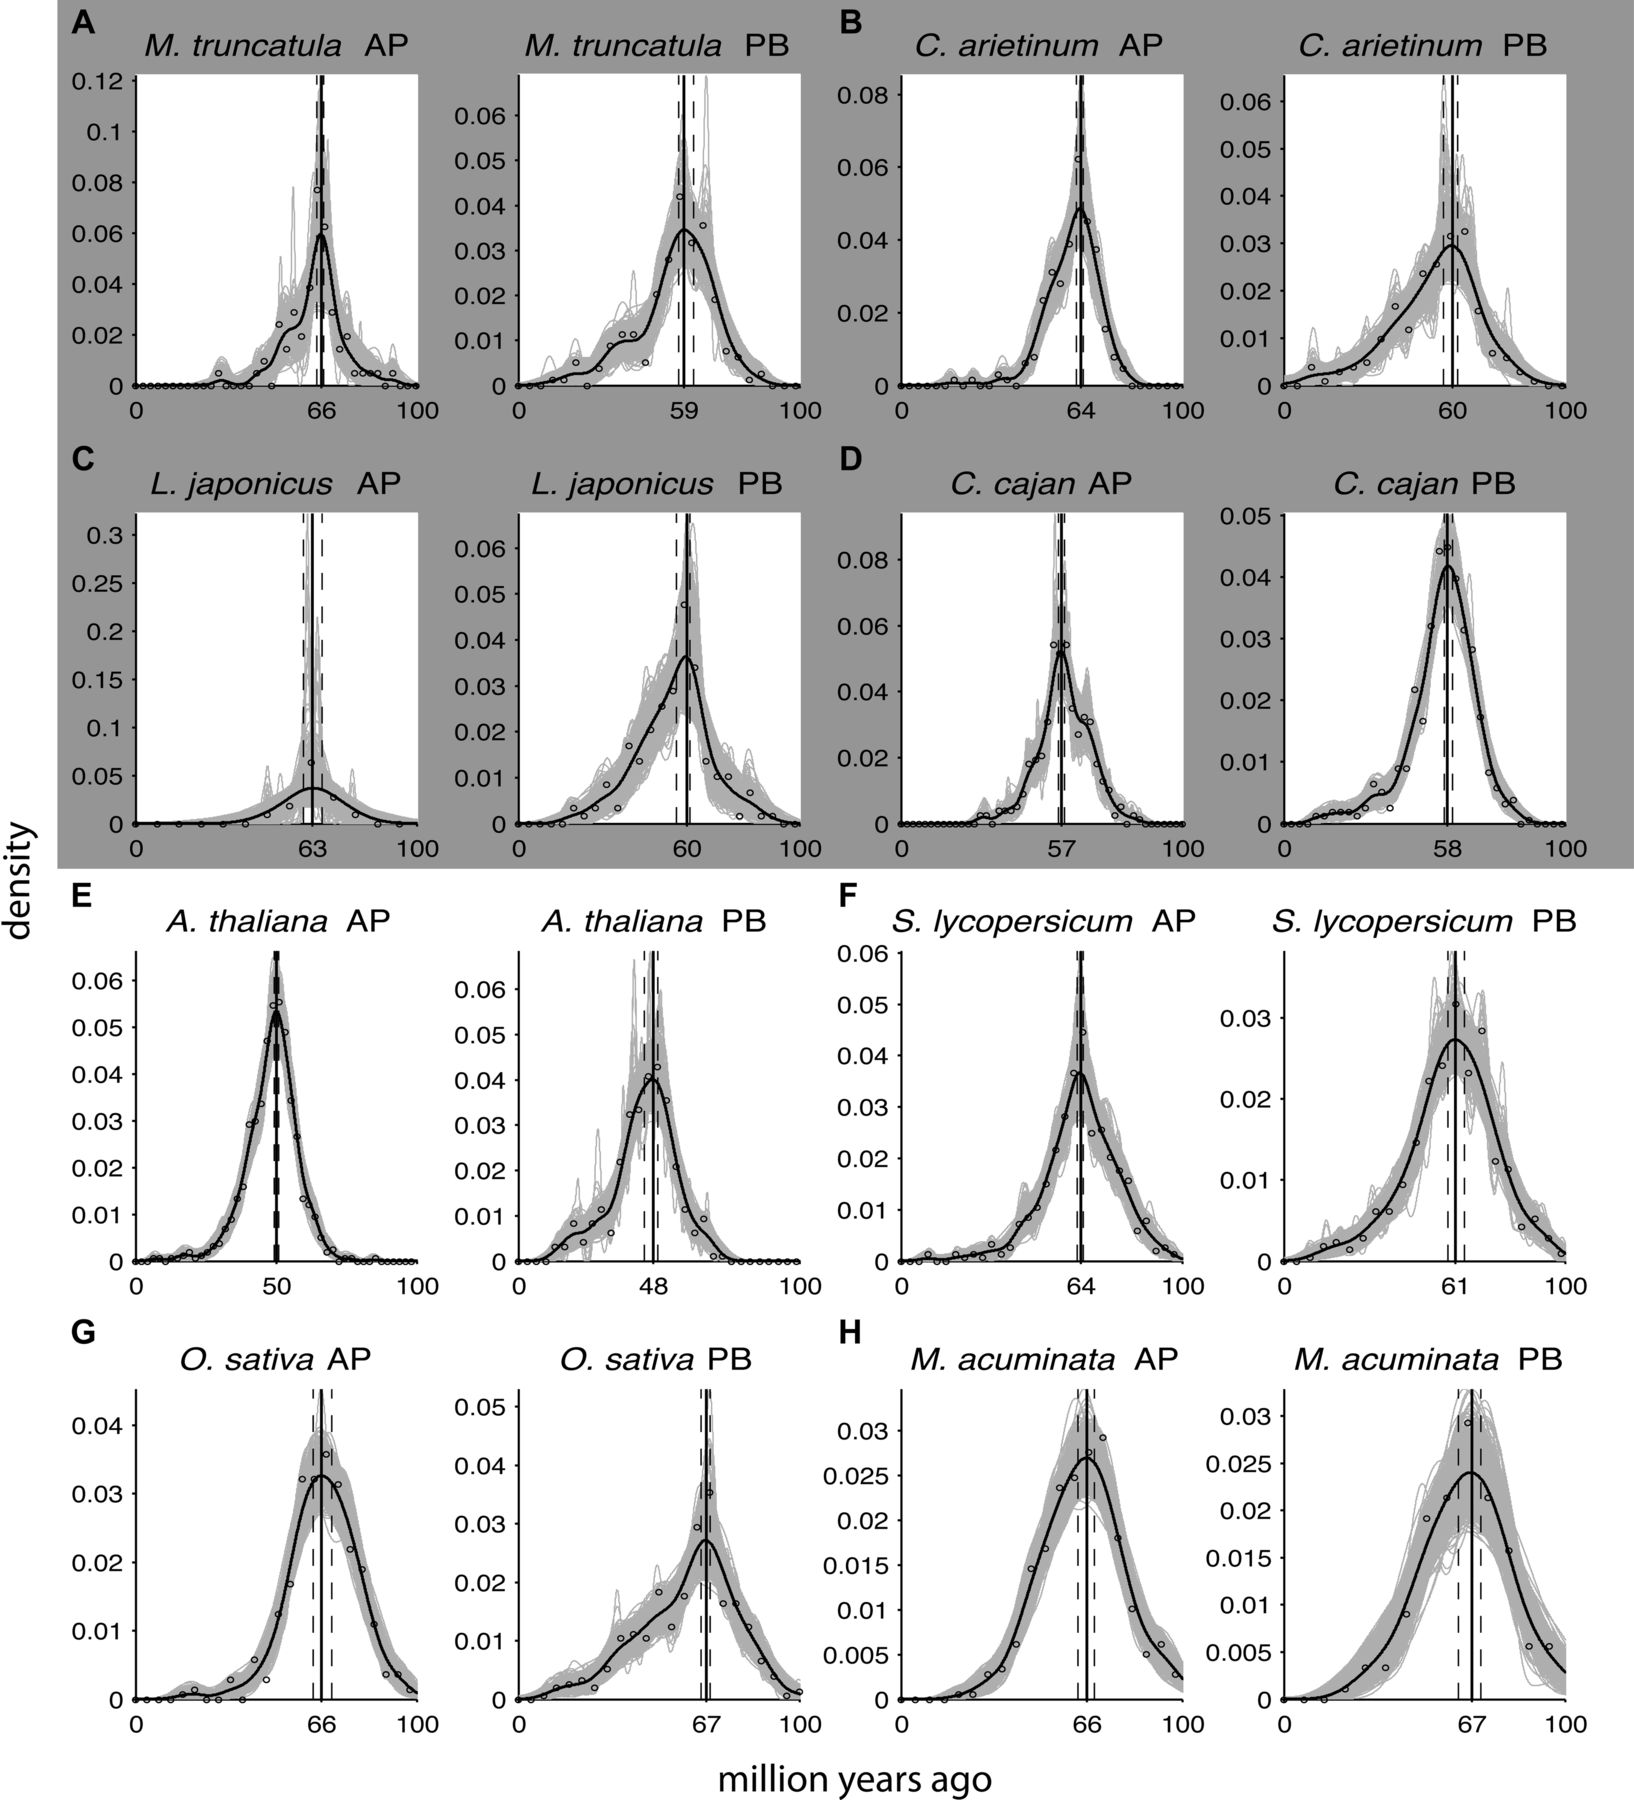
Absolute age distributions of the dated anchors (AP, left) and peak-based duplicates (PB, right) for (A) M. truncatula, (B) C. arietinum, (C) L. japonicus, (D) C. cajan, (E) A. thaliana alpha duplication, (F) S. lycopersicum, (G) O. sativa, and (H) M. acuminata. (Nonvertical black solid line) Kernel density estimate of the dated homeologs; (vertical black solid line) its peak used as the WGD age estimate. (Gray solid lines) Density estimates for the 1000 bootstrap replicates; (vertical black dashed lines) corresponding 90% confidence intervals on the WGD age estimate. The original raw distribution of dated homeologs is also indicated on the individual plots by open dots. See Table 1 for sample sizes and exact confidence interval boundaries. The gray box surrounding A–D indicates that these four species represent the same Faboideae-specific WGD.


