
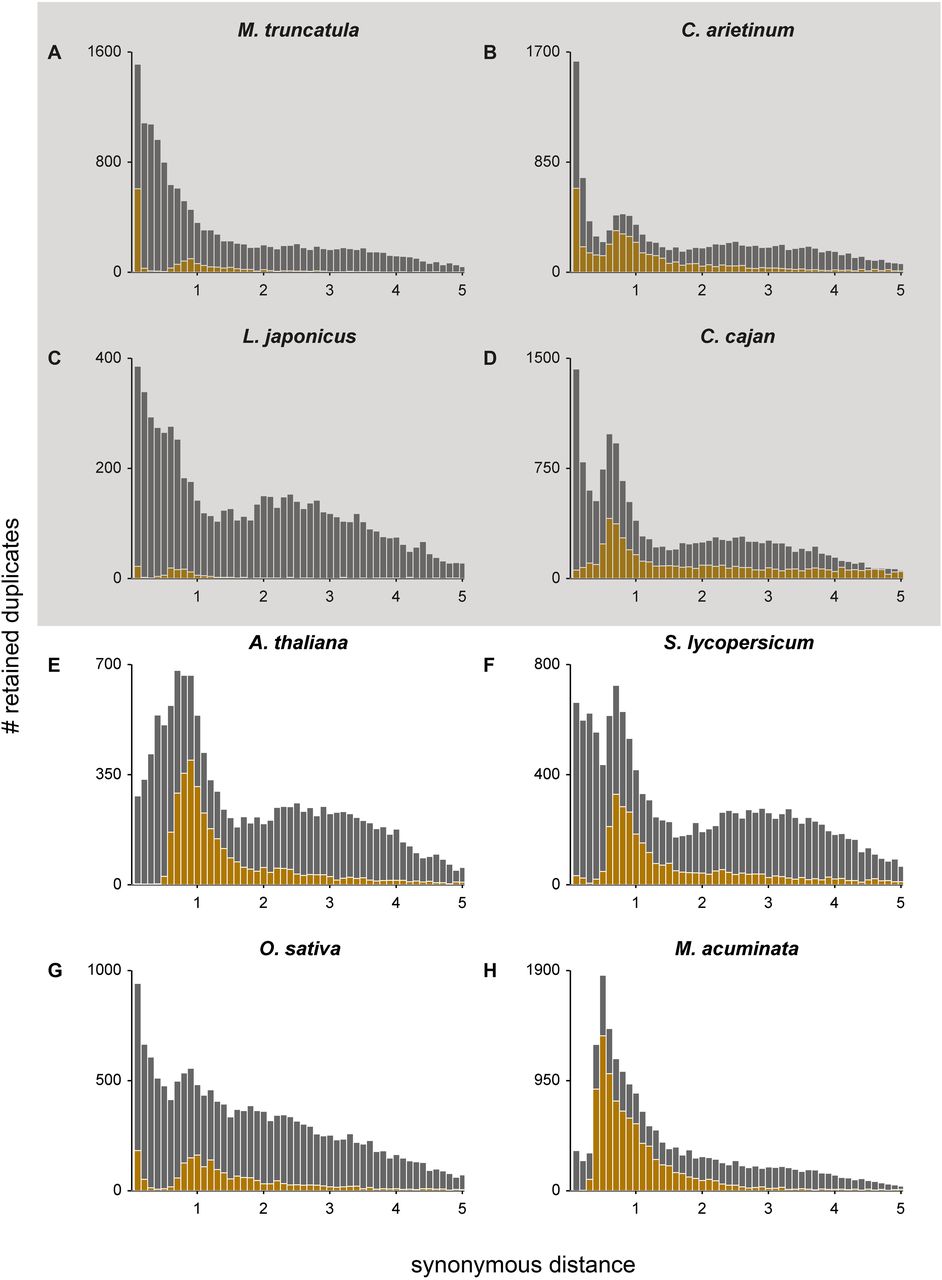
Figure 1.
KS age distributions for (A) M. truncatula, (B) C. arietinum, (C) L. japonicus, (D) C. cajan, (E) A. thaliana, (F) S. lycopersicum, (G) O. sativa, and (H) M. acuminata. The gray and gold bars represent the distribution of the paranome and duplicated anchors identified with i-ADHoRe, respectively. Anchors and peak-based duplicates used as homeologs for absolute dating were extracted from between the WGD peak boundaries (see Table 1). The gray box surrounding A–D indicates that these four species represent the same Faboideae-specific WGD.


