
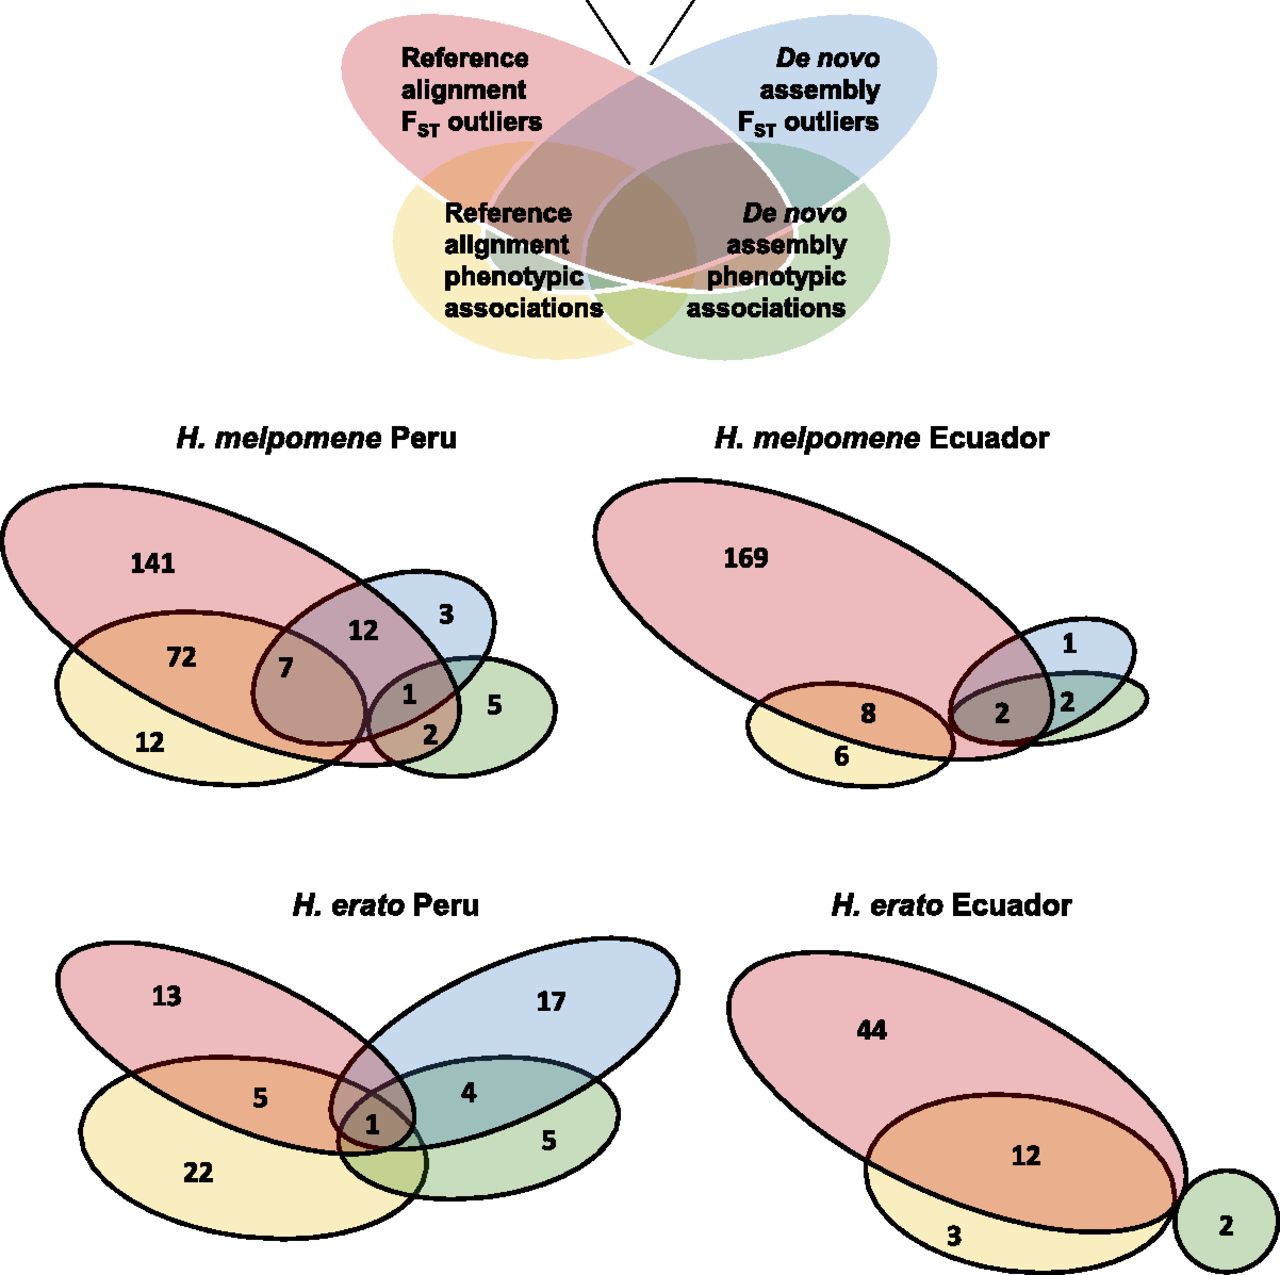
Figure 5.
Venn diagrams of SNPs detected in the de novo assembled (blue and green) and reference aligned (yellow and red) data by BayeScan outlier detection (red and blue) and association mapping (yellow and green), for each of the four populations.


