
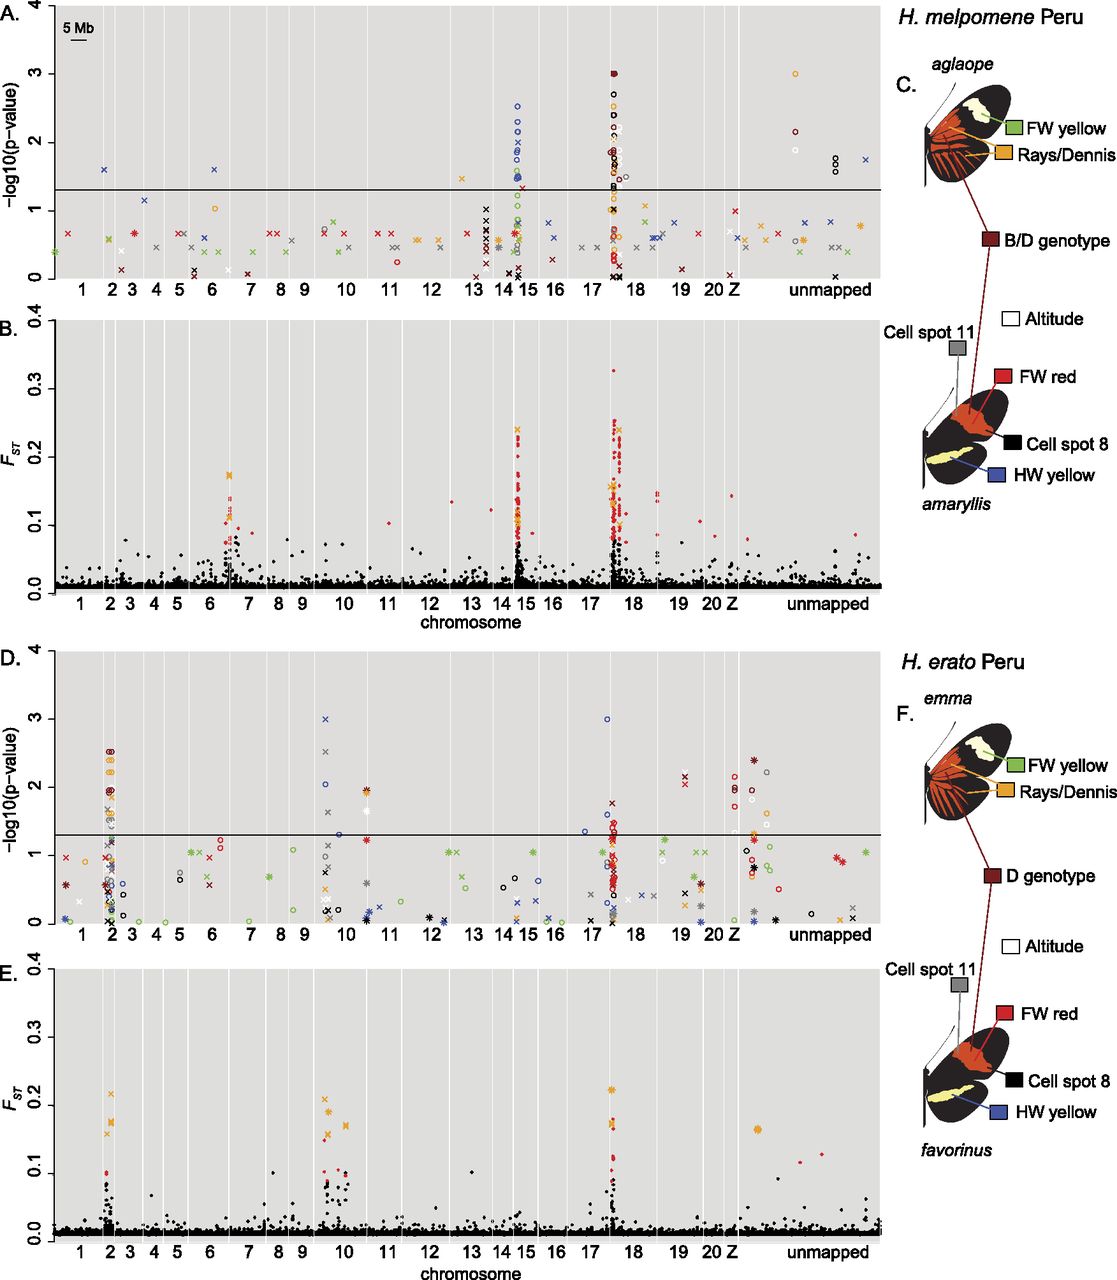
Association mapping (A,D) and outlier analysis (B,E) for H. melpomene (A–C) and H. erato (D–F) in Peru. Each phenotype used for the association mapping is shown in a different color as illustrated in C and F. For clarity, only the top 20 associated SNPs are shown for each phenotype. The outlier analysis results show FST values for all SNPs, with significant outliers shown in red. Results from the de novo assembled data are shown as crosses (and in orange for the outlier analysis) and positioned based on the top BLAST hit to the H. melpomene genome; those that were not confidently or uniquely assigned to these positions are shown as stars (e.g., those at the end of chromosome 10 in D). (Unmapped) Scaffolds of the H. melpomene reference genome that were not assigned to chromosomes in v1.1 of the genome assembly.


