
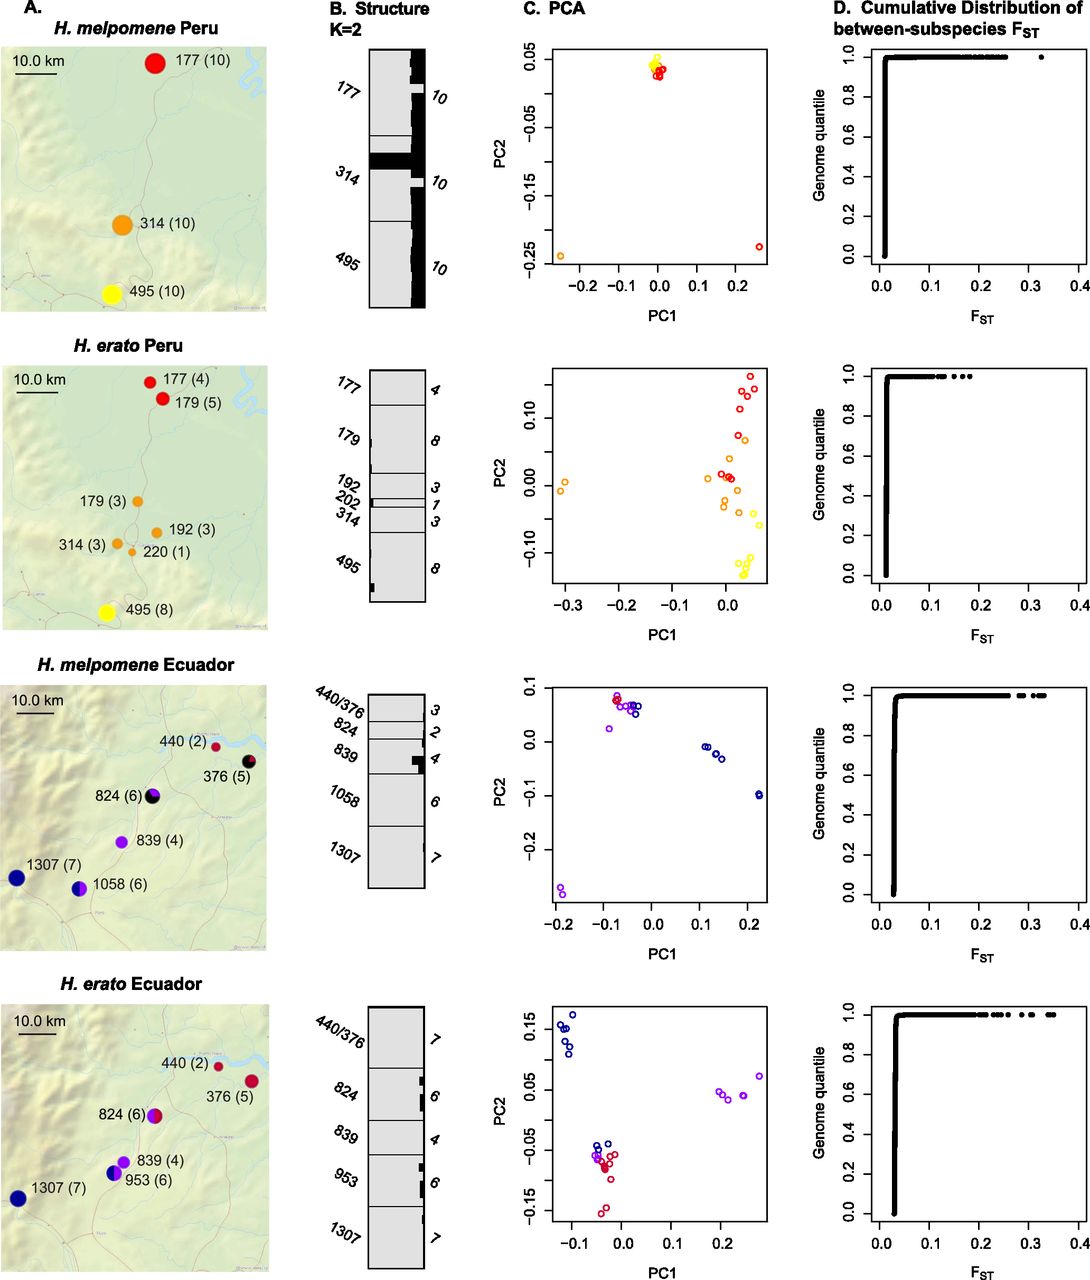
Figure 2.
Population structure at each of the hybrid zones using the reference aligned data. (A) Sampling locations with altitude in meters, sample size in parentheses, and pie charts of the proportion of individuals of each type sampled from each site. Colors are the same as in Figure 1, except black indicates H. timareta in Ecuador. (B) Structure analysis with k = 2 (H. timareta individuals excluded). Each individual is shown as a horizontal bar with the allelic contribution from population 1 (gray) and population 2 (black). (C) Principal components analysis. (D) Distribution of FST values from BayeScan.


