
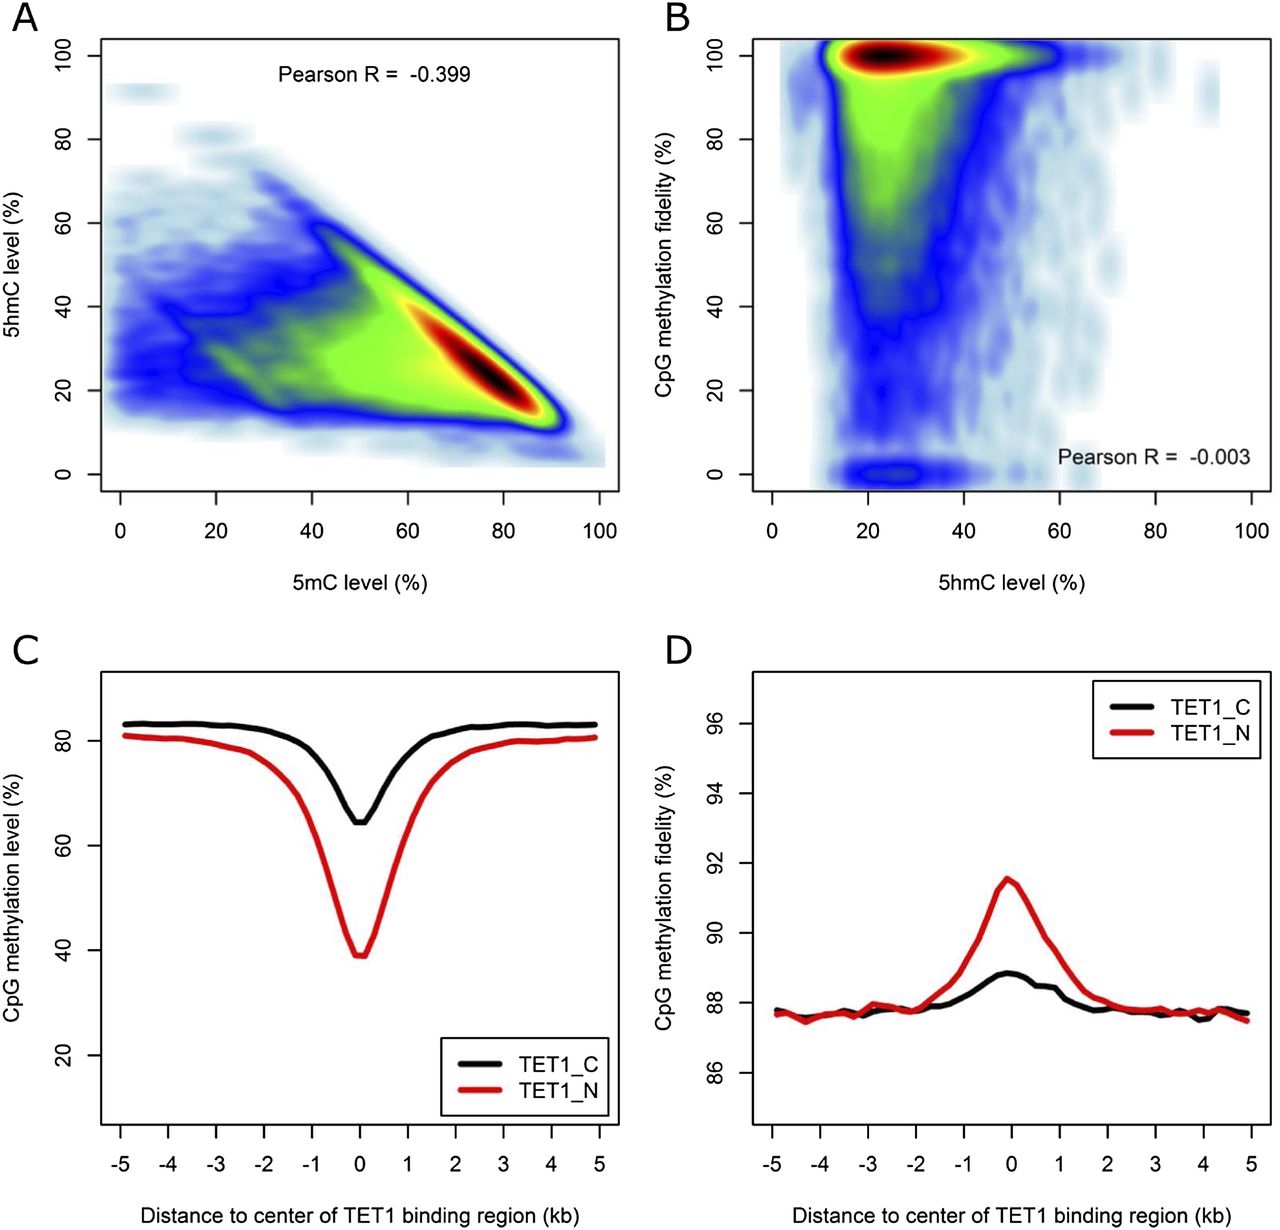
Figure 6.
Relationship between DNA methylation and hydroxymethylation. (A) Scatter plot showing the relationship between 5-mC and 5-hmC. (B) Scatter plot showing the relationship between 5-hmC level and CpG methylation fidelity. (C,D) Profiles of methylation level and methylation fidelity surrounding TET1-binding regions calculated using 200-bp sliding windows.


