
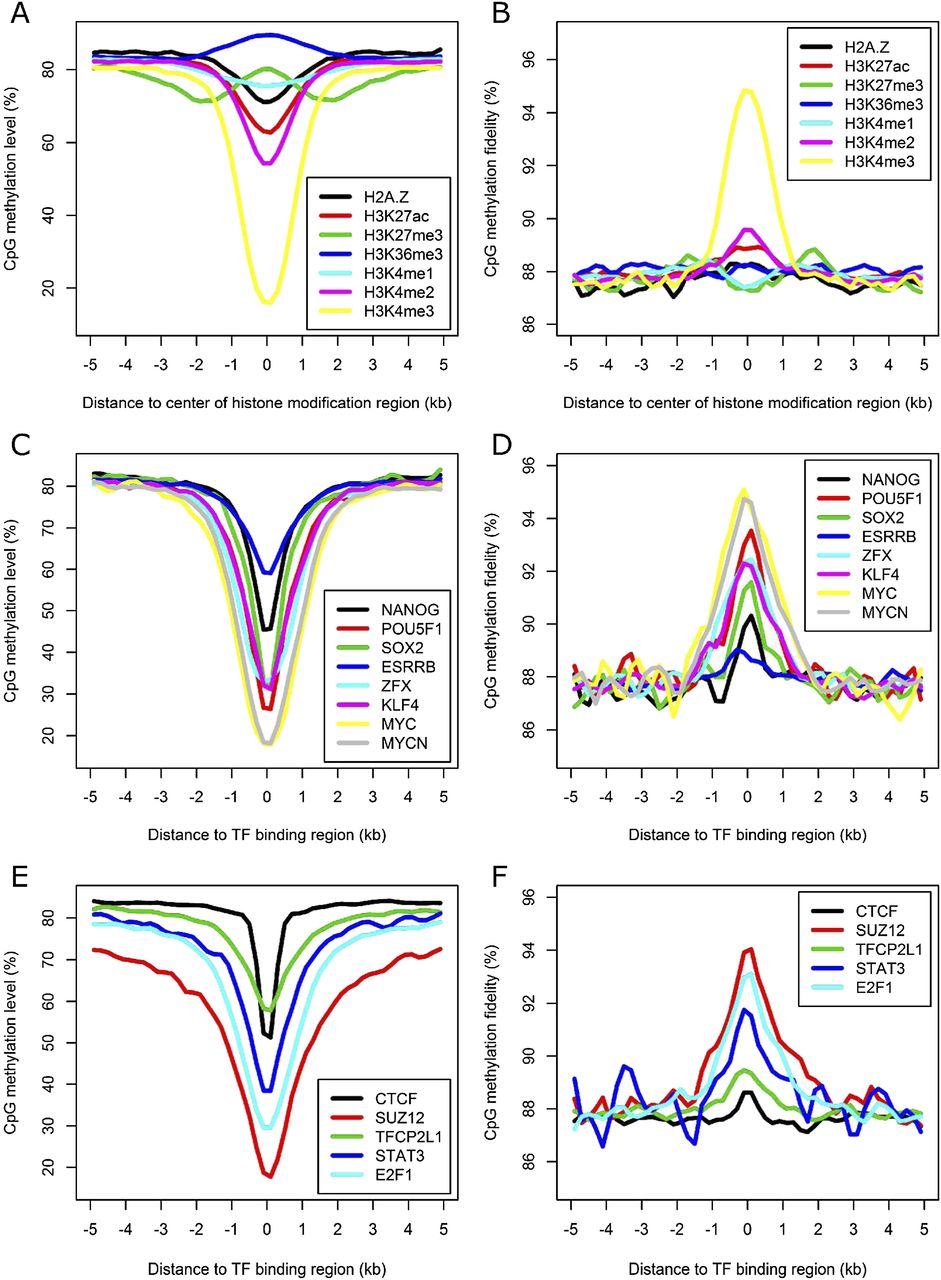
Figure 5.
DNA methylation level and fidelity at regions with various histone modifications and TF binding in E14-d0. (A,B) Profiles of methylation level and fidelity of regions enriched for various histone modifications. (C–F) Profiles of methylation level and fidelity surrounding the binding regions of various TFs or regulators. The smoothed lines represent the average methylation level and fidelity surrounding the center of various histone modifications (A,B) and TF-binding regions (C–F), which were calculated using 200-bp sliding windows.


