
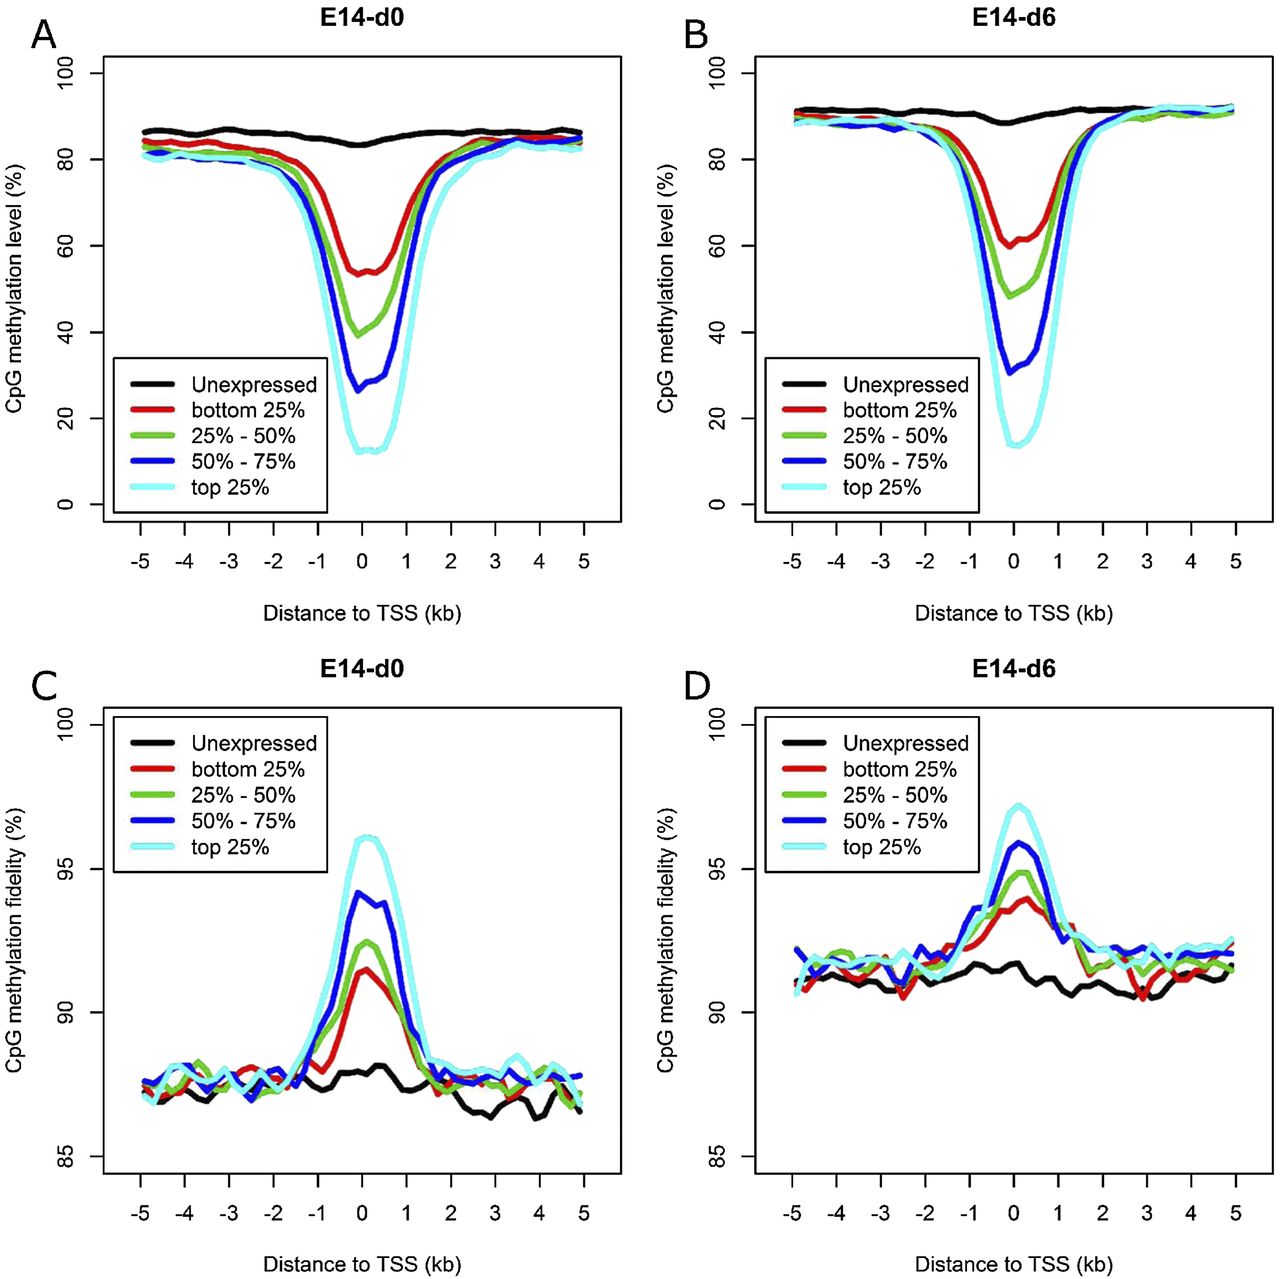
Figure 4.
Relationship between DNA methylation and gene expression. (A,B) Average methylation level of the promoters for genes ranked by expression level in E14-d0 and E14-d6. (C,D) Average methylation fidelity of the promoters for genes ranked by expression level in E14-d0 and E14-d6. The smoothed lines represent the average methylation level and fidelity surrounding TSSs calculated using 200-bp sliding windows.


