
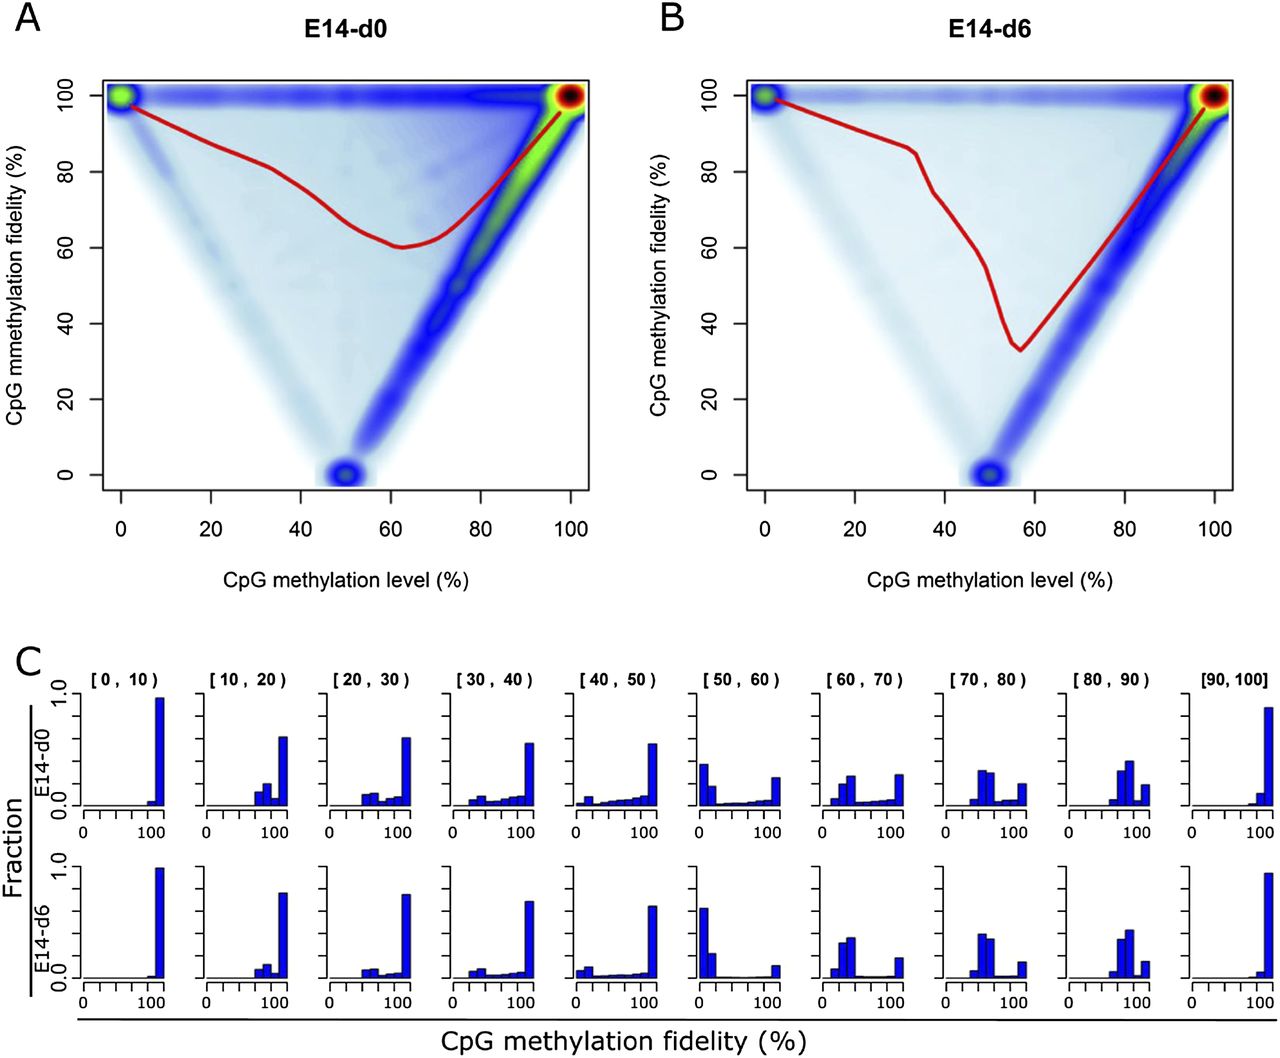
Figure 3.
CpG methylation fidelity follows a bimodal distribution. (A,B) Scatter plots showing the relationship between methylation level and methylation fidelity in E14-d0 (A) and E14-d6 (B). The smoothed lines represent the mean methylation fidelity along the change of methylation level. (C) Histograms showing the distribution of methylation fidelity for CpG sites with methylation levels at 10 intervals in E14-d0 and E14-d6, respectively. The methylation level intervals are indicated in brackets on the top of each subplot.


