
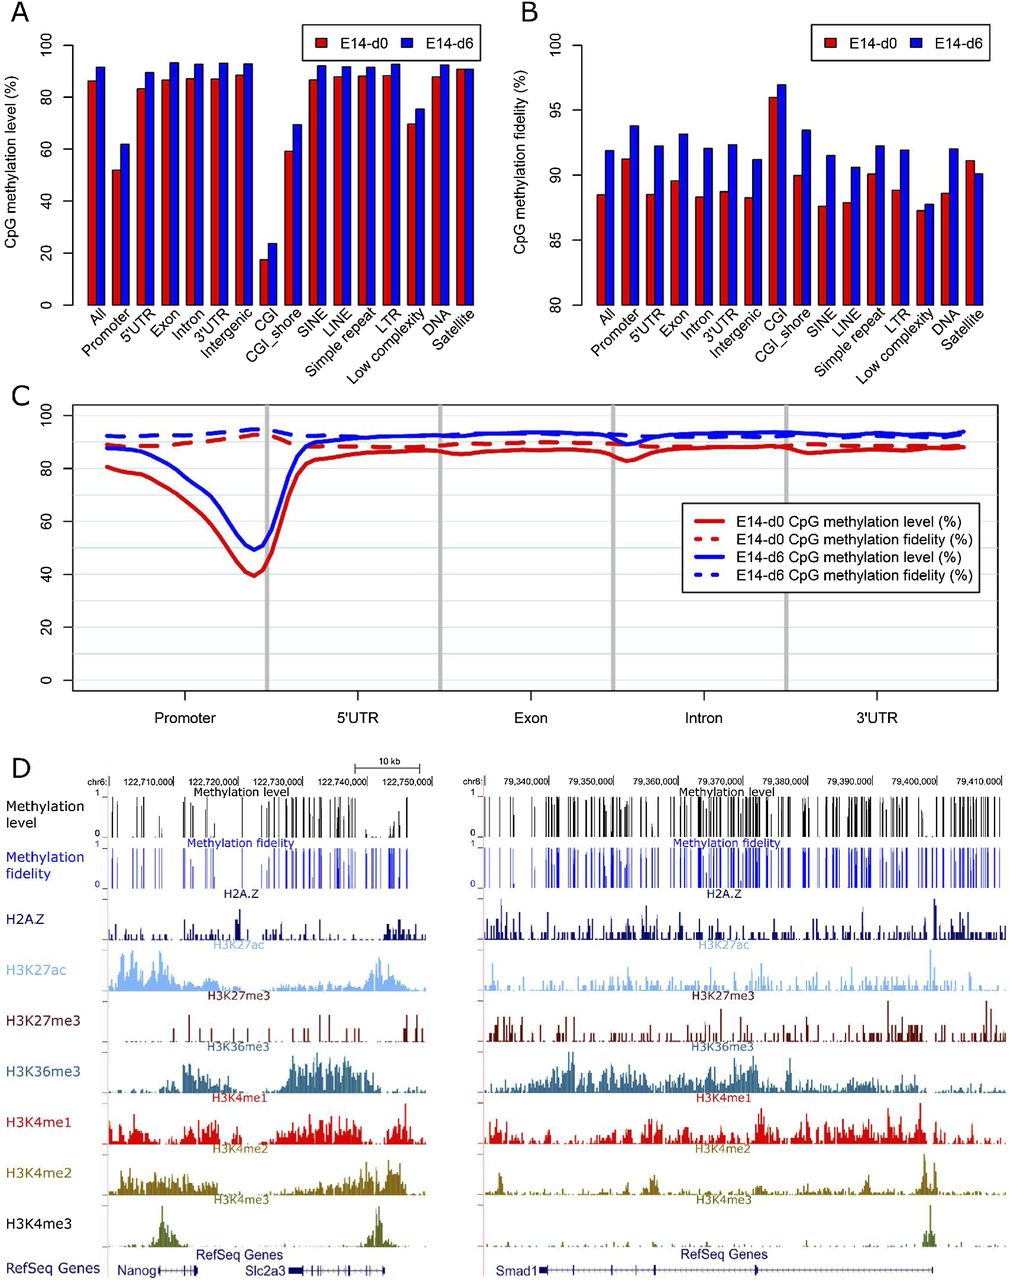
Figure 2.
Characteristics of DNA methylation level and fidelity for CpG dyads at different genomic regions. (A,B) Bar plots showing the methylation level (A) and fidelity (B) of CpG dyads at different genomic regions. (C) CpG methylation level and fidelity along different gene-associated regions. The smoothed lines represent the mean methylation level (solid lines) and fidelity (dashed lines). (D) Genome browser representation of methylation level, methylation fidelity, and various histone modifications at genes including Nanog, Slc2a3, and Smad1.


