
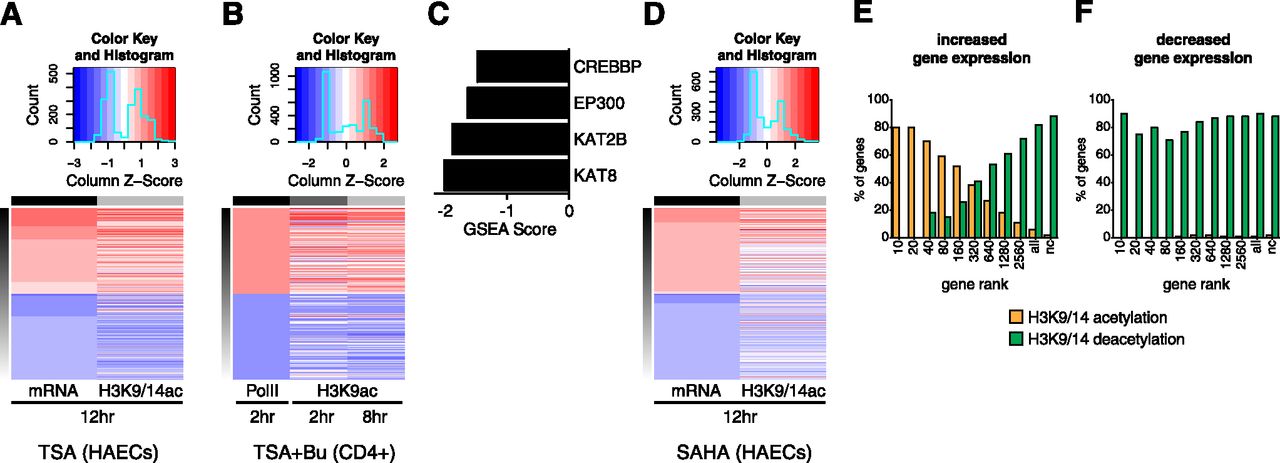
Genome-wide deacetylation using HDAC inhibitors. (A) Heat map showing gene expression (adjusted P < 0.05) and corresponding histone acetylation changes. HAECs were stimulated with 500 nM TSA for 12 h, and the corresponding changes in H3K9/14ac (ChIP-seq) at the promoter region were intersected with gene expression (mRNA-seq). (Red) Increases in gene expression and histone acetylation; (blue) corresponding decreases. (B) Heat map of changes in gene expression, based on Pol II ChIP-seq, in CD4+ T-cells stimulated with 100 ng/mL TSA and 2 mM sodium butyrate for 2 h, and corresponding changes in H3K9ac (at 2 and 8 h). Data derived from GEO (Series ID: GSE15735). (C) Normalized enrichment scores derived from GSEA showing the association of HATs in native CD4+ T-cells (determined by ChIP-seq) and changes in acetylation following 8 h stimulation with 100 ng/mL TSA and 2 mM sodium butyrate. (D) Heat map showing changes in gene expression (adjusted P < 0.05) in SAHA-stimulated HAECs (2 μM, 12 h) and corresponding changes in H3K9/14ac at gene promoters. (E,F) Gene expression changes are associated with H3K9/14ac modification in SAHA-stimulated HAECs. Genes were ranked based on expression derived from mRNA-seq analysis. (For example, the top “10” genes are shown followed by the top “20” genes and so on [adjusted P < 0.05].) The largest category represents “all” genes and “nc” refers to no change in gene expression.


