
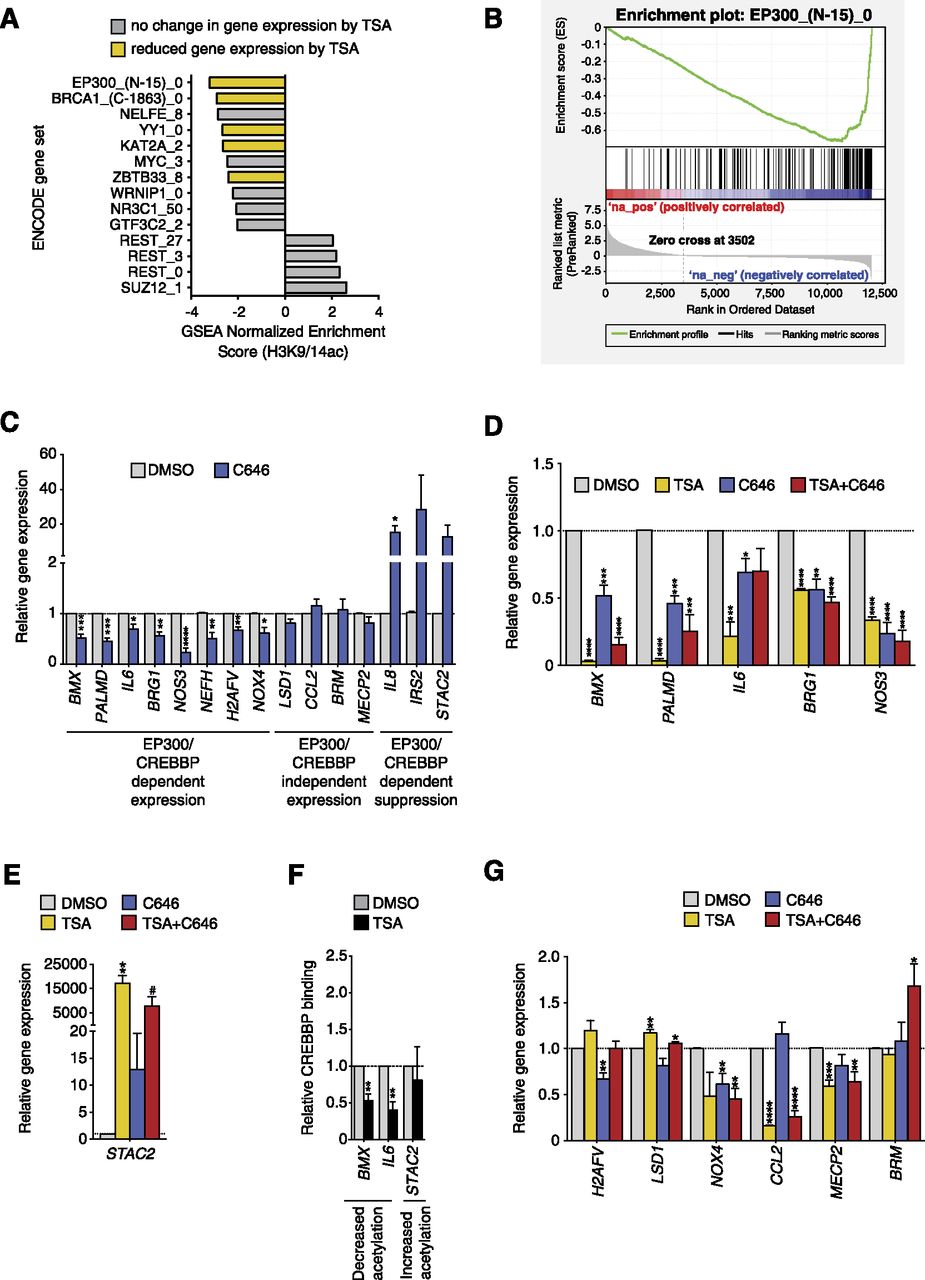
Loss of EP300/CREBBP HATs at gene promoters is associated with histone deacetylation. (A) GSEA identifies changes in transcription factor binding at deacetylated gene promoters using the ENCODE ChIP-seq collection of various transcription and coregulatory factors and chromatin-associated proteins (TFBS). A negative normalized enrichment score (NES) shows deacetylated gene sets, while a positive NES score indicates gene sets associated with histone acetylation. All gene sets are NOM P-value < 0.05 and FDR Q-value < 0.05 according to the standard GSEA output. Yellow bars indicate corresponding changes in gene expression of the DNA or chromatin-bound factors in TSA-stimulated HAECs (adjusted P < 0.05). Numbers following the protein name represent the cell line and have been defined in the Supplemental Methods. (B) GSEA plot showing an association of EP300-bound genes associated with histone deacetylation in response to TSA. Genes are ranked by changes in H3K9/14ac. (C) Gene expression changes of HAECs exposed to the C646 EP300/CREBBP inhibitor compared to DMSO control, determined by qRT-PCR. Genes are divided into three groups based on EP300/CREBBP-dependent regulation. The first group comprises expressed genes dependent on EP300/CREBBP; the second group is EP300/CREBBP-independent genes; and the third group is suppressed genes dependent on EP300/CREBBP. All data, n = 4, except for IL8 and IRS2, n = 3. (D,E) qRT-PCR was performed in TSA-stimulated HAECs (500 nM, 12 h), C646 (20 μM, 15 h), and a combination of both C646 and TSA (C646: 20 μM, 15 h; TSA: 500 nM, 12 h). All changes in expression (TSA, C646, TSA + C646) are relative to the DMSO control. Gene expression was determined by normalizing against HPRT1. TSA-stimulated changes in gene expression are shown for genes with promoters associated with decreased (D) and increased (E) histone acetylation. (F) ChIP analysis was performed using anti-CREBBP antibody in TSA-stimulated HAECs (TSA: 500 nM for 12 h). (G) TSA-dependent changes in gene expression regulated by the C646 EP300/CREBBP inhibitor. Error bars represent SEM. For DMSO-, TSA-, and C646-treated cells, n = 4. For TSA + C646 treated cells, n = 3. For CREBBP ChIP, n = 3. (*) P < 0.05, (**) P < 0.005, (***) P < 0.0005, (****) P < 0.0001, (#) P < 0.06, unpaired t-test.


