
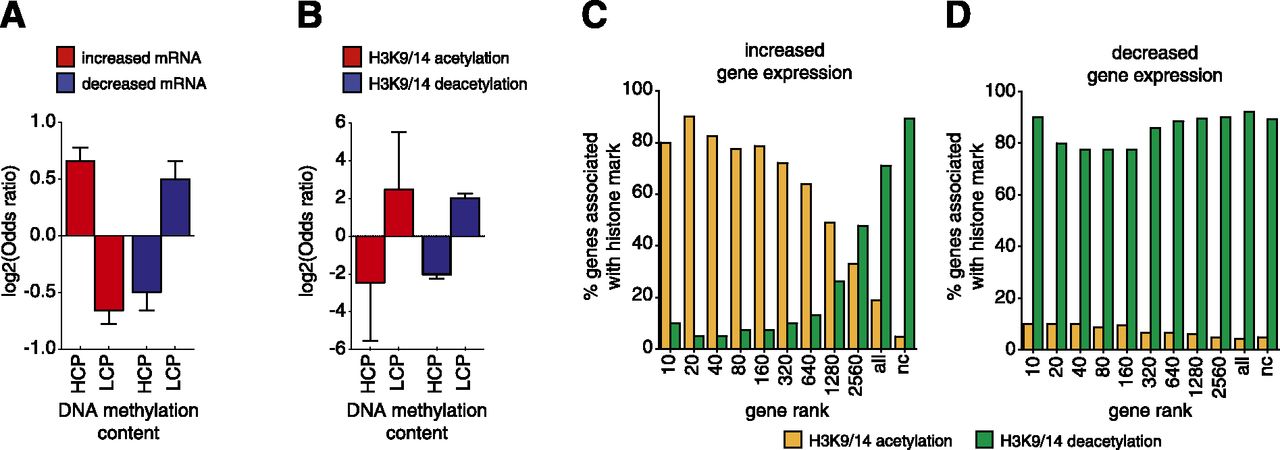
DNA methylation is correlated with the action of TSA at gene promoters. Fisher’s exact test was used to correlate gene expression and H3K9/14ac with DNA methylation. DNA methylation regions with a concentration (log2 of the average number of reads in all samples per region, i.e., logConcentration determined by edgeR) of greater than −17 were classified as high levels of methylation (HCP), and regions below −17 were defined as low DNA methylation (LCP). Error bars represent 95% confidence intervals of the log2 of the odds ratio. (A) Changes in mRNA expression were defined as log2FC > 0 (increased gene expression) or log2FC < 0 (decreased gene expression), and adjusted P < 0.05. (B) Regions of acetylation were defined as log2FC > 1 (increased acetylation) or log2FC < −1 (decreased acetylation), adjusted P < 0.05. Only regions with preexisting histone acetylation (cutoff of 400 reads) were included in the analyses. Correlations between increased (C) and decreased (D) gene expression are shown for histone acetylation (yellow) and deacetylation (green). Genes were grouped (x-axis) according to the level of up- or down-regulation observed from the mRNA-seq analysis, as a cumulative rank (i.e., top 10 genes, top 20 genes, and so on, where the largest “all” category represents the whole gene set and “nc” represents no change, adjusted P < 0.05). The correlation is reported as the percentage of genes in each rank associated with changes in H3K9/14ac at the promoter.


