
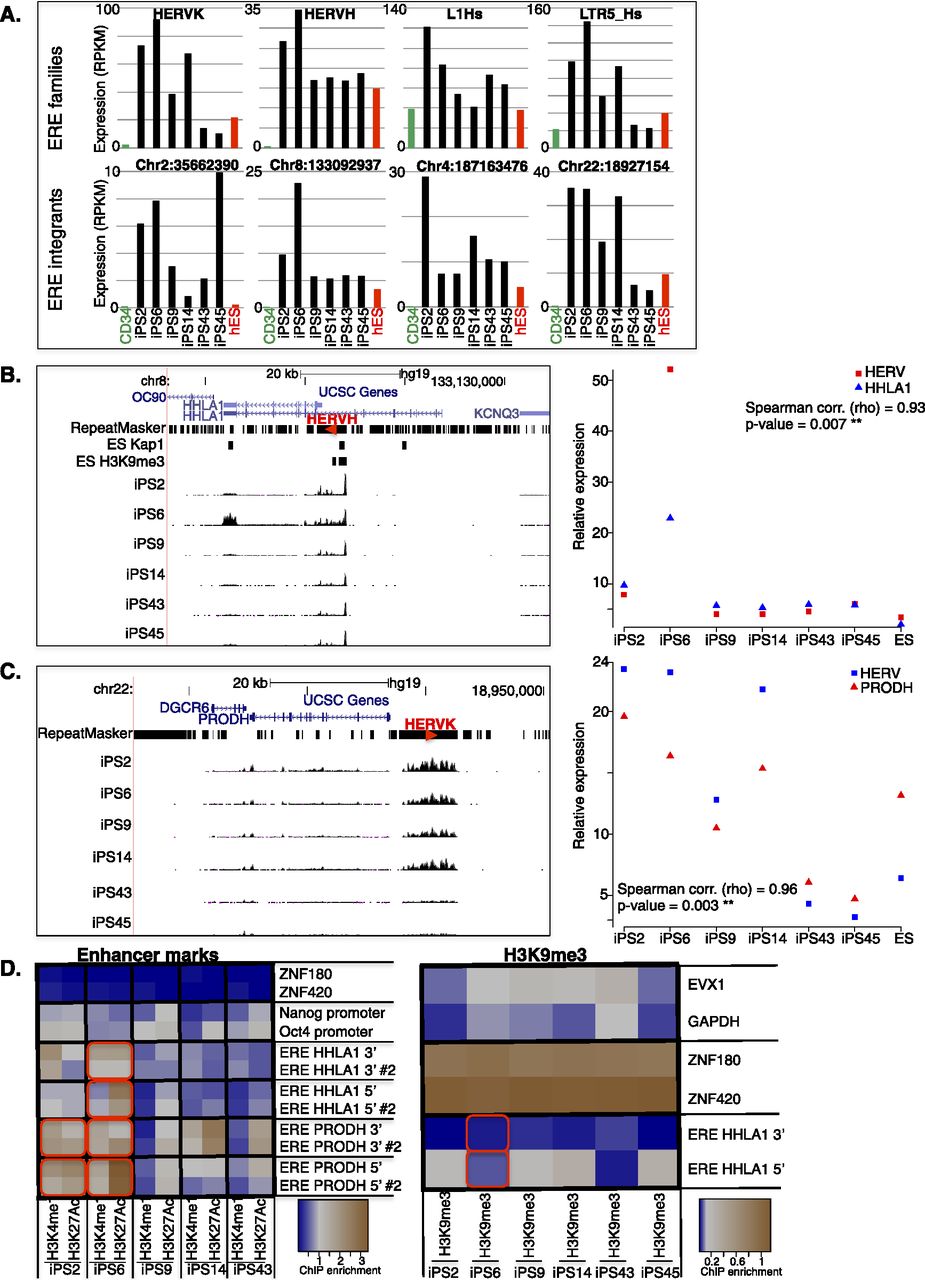
Clonal variability of ERE control in iPSCs. (A) Comparative expression of indicated ERE families (top) in parental CD34+ cells (average of three samples), in six iPSC clones simultaneously derived from their reprogramming, and in control H1 ES cells. (Bottom) Expression levels of individual HERV integrants in same cells as A (top). (B,C) Two examples of dysregulated HERV integrants and expression level of closest genes, HHLA1 for a HERVH on chromosome 8 (B) and PRODH for a HERVK on chromosome 22 (C). (Left) Expression level tracks, as well as hES H3K9me3 and TRIM28 binding data (obtained by ChIP-seq). Note that for the PRODH locus, ChIP-seq reads could not be mapped due to the high redundancy of this region, preventing binding site calling at this location. Red arrowheads indicate HERV orientation. (Right) Expression levels of ERE–gene pairs, with Spearman correlation calculated. (D) Activation (H3K4me1 and H3K27ac) and repressive (H3K9me3) histone marks at HERVs situated close to HHLA1 and PRODH and controls (activation mark negative controls, ZNF180 and ZNF420; positive controls, POU5F1 [OCT4] and NANOG promoters; H3K9me3 negative controls, EVX1 and GAPDH; positive controls, ZNF180 and ZNF420) depicted as a heatmap from least (blue) to most (brown) enriched. Two qPCR assays (e.g., ERE PRODH 5′ and ERE PRODH 5′ #2) were designed on the 5′ and 3′ of each ERE. Note active enhancer marks on the ERE near PRODH in iPS clones 2, 6, and 14 compared with iPS clones 43 and 45, and on the ERE near HHLA1 in iPS clone 6 compared with other clones. Up-regulated ERE–gene pairs are highlighted with a red box for appropriate iPS clones.


