
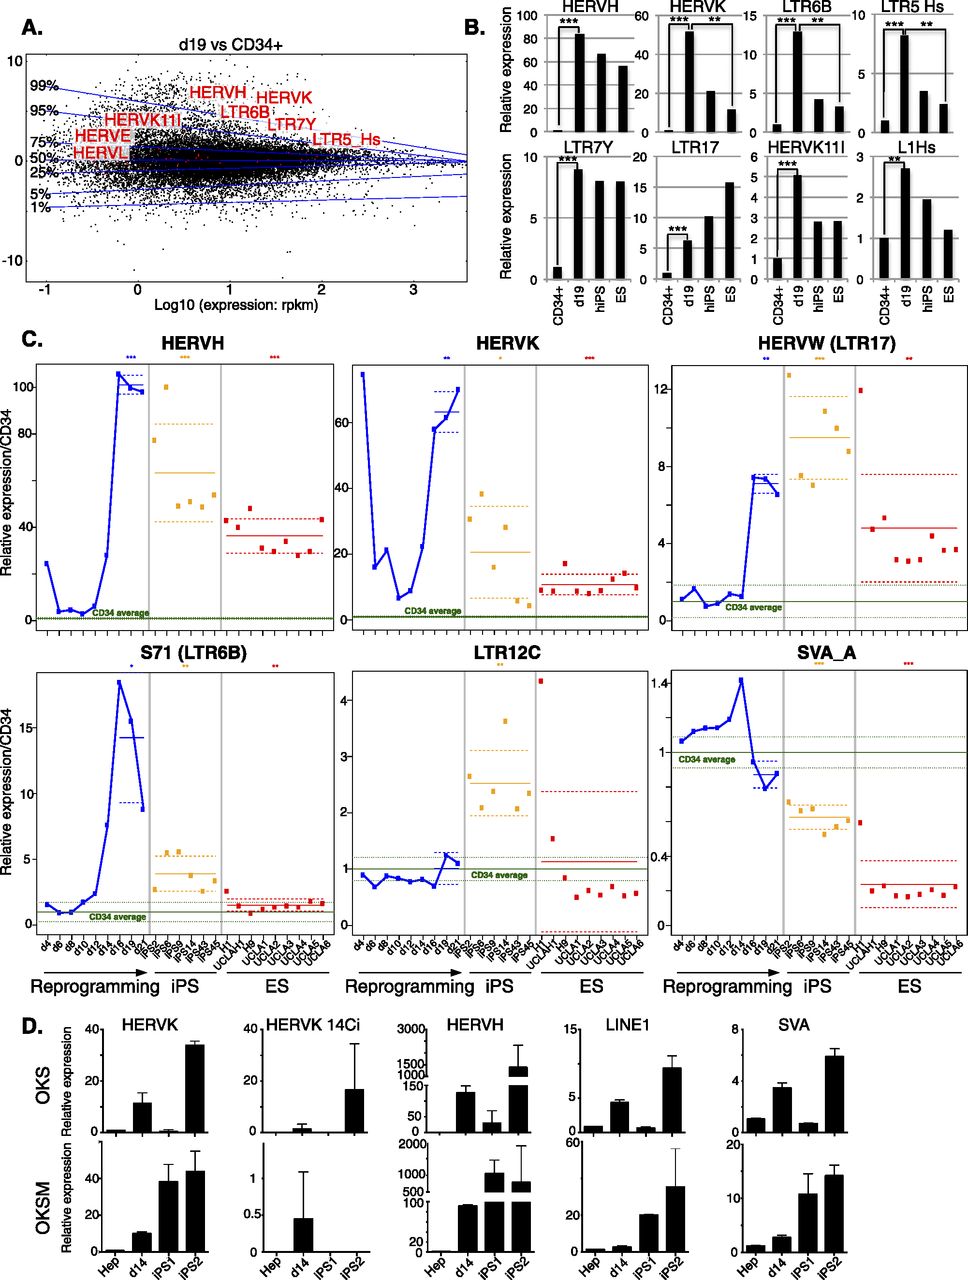
De-repression of individual EREs during reprogramming and in iPSCs. (A) MA-plot comparing RNA-seq–determined transcriptome of day 19 (d19) OKS-transduced vs. parental CD34+ cells. Transcripts (RefSeq) are plotted in black with the ratio (d19/CD34+) on the y-axis and expression levels on the x-axis. Representative up-regulated Repbase families are shown in red. Transversal blue lines depict magnitude of gene deregulation (e.g., only 1% of genes lie above the 99% line). (B) Expression levels of indicated HERVs in parental (average of three samples) or d19 OKS-transduced CD34+ cells, human iPS cells (average of six clones from the same reprogramming experiment), and the H1 ES cell line (average of two samples). Fold changes compared with CD34+ triplicates and P-values are calculated using the DESeq package (Anders and Huber 2010). (C) Relative expression of indicated HERVs during reprogramming of CD34+ cells, in six resulting iPSC clones (orange dots) and nine independent samples of hES cells (red dots). Green line indicates parental cells (average of three, same donor); dotted green lines, plus and minus standard deviation; and solid blue line, reprogramming time points. The horizontal (blue, orange, and red) solid lines show the mean of each group of samples. Dotted lines show a 95% confidence interval for each mean. We performed a Wilcoxon test for each mean to test if it was different from one. (D) qPCR quantification of transcripts from indicated human EREs during reprogramming of primary hepatocytes. (Top) Reprogramming with OKS. (Bottom) Reprogramming with OKSM. (Hep) Average of four nontransduced hepatocyte samples.


