
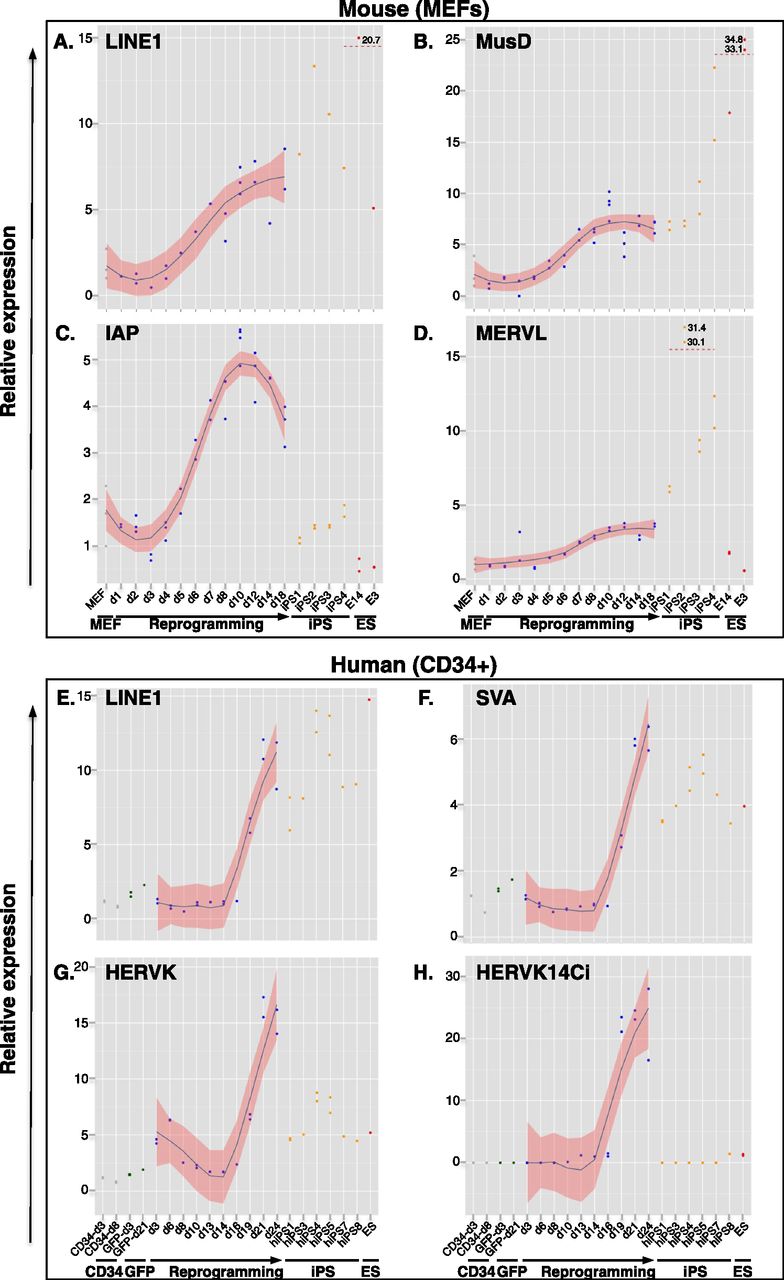
Figure 1.
Global up-regulation of EREs during reprogramming. qPCR quantification of transcripts from indicated murine (A–D) and human (E–H) EREs during reprogramming of MEFs and cord blood CD34+ cells, respectively. Expression levels are indicated for parental cells (gray dots), cells transduced with an SFFV-GFP control vector (green dots), OKS-induced reprogramming time points (blue dots), individual iPS clones (orange dots), and ES cells (red dots). For the smoothing pattern across OKS-induced reprogramming time points, we computed a locally weighted polynomial regression (LOESS) with a 95% confidence interval.


