
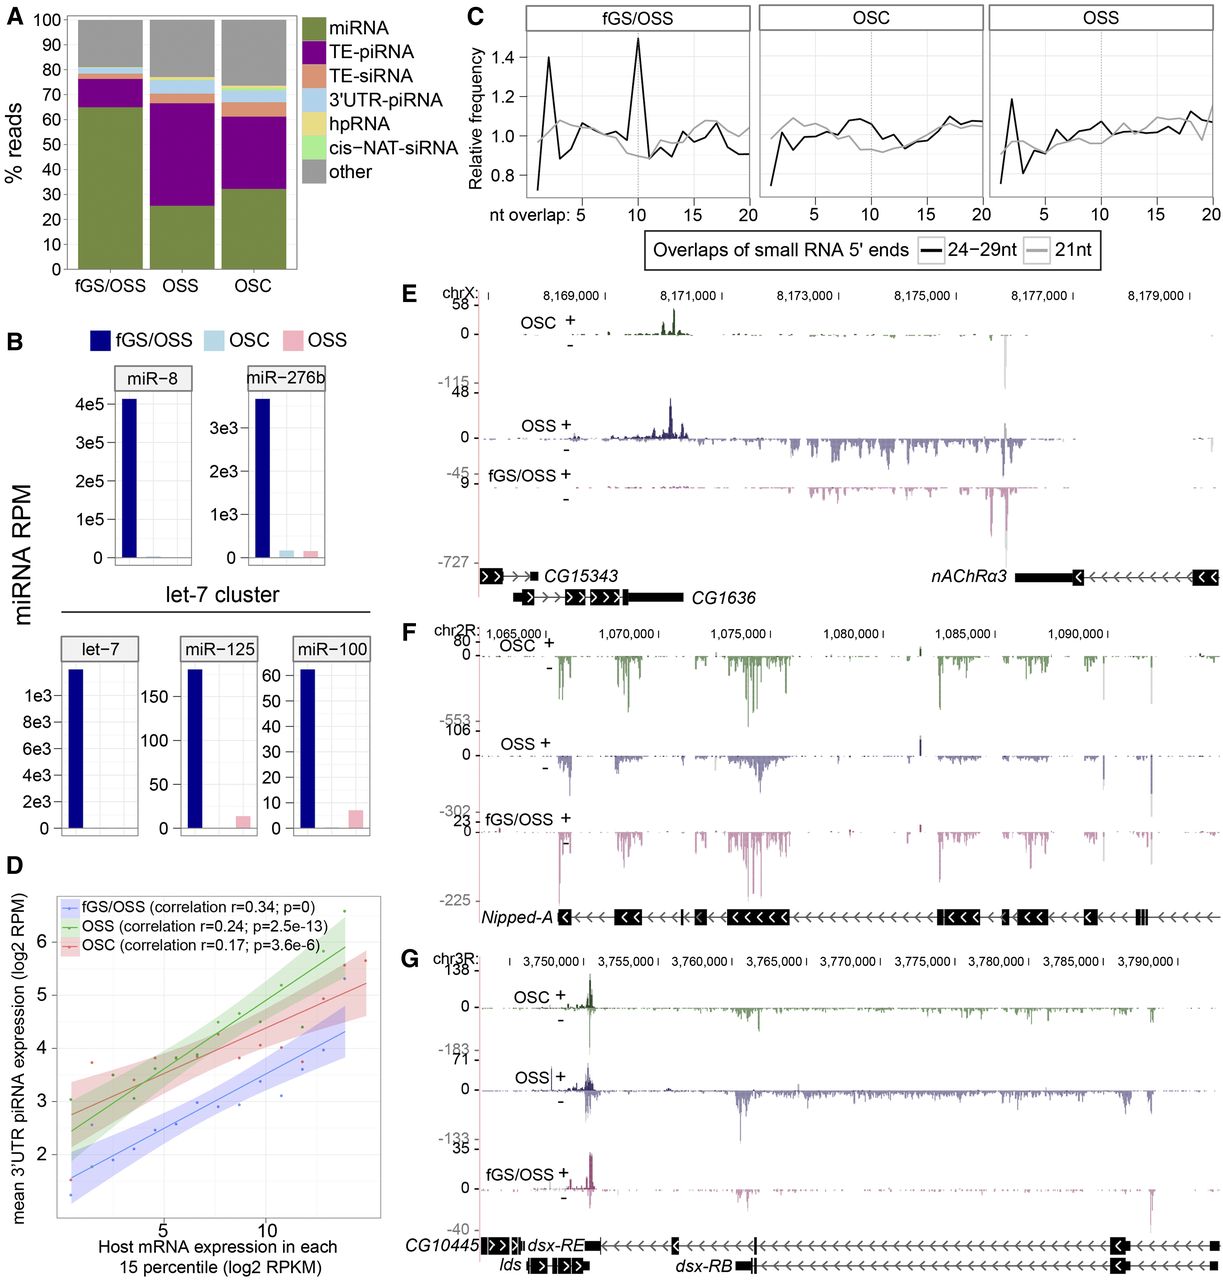
Analysis of miRNAs and piRNAs in ovarian cell lines. (A) Expression distribution (percentage relative to total mapped reads) of annotated endogenous small RNAs in ovarian cell lines. (B) Examples of miRNAs that are highly expressed only in fGS/OSS and not in either the OSS or OSC cell lines. We infer that these miRNAs are specific to the “fGS” component of fGS/OSS, i.e., that they are germline-specific miRNAs. (C) Ping-pong signatures showing a characteristic peak at a 10-bp overlap between the 5′ ends of complementary species are found specifically among the 24- to 29-nt reads of fGS/OSS cells, but not among their 21-nt reads. OSC and OSS do not show such a signature. (D) Correlation of 3′ UTR-piRNAs and their host genes. The distribution across 15 percentiles of host gene expression (x-axis) vs. mean 3′ UTR piRNA expression (y-axis) is plotted. Linear regression lines were fit to the binned data, and bands show the standard error at each position. Correlation coefficients were calculated using all raw data. (E) Example of a novel 3′ UTR-piRNA locus that is specific to fGS/OSS cells. (F) Example of piRNAs produced from Nipped-A coding regions. (G) Example of piRNAs mainly produced from dsx introns. The 3′ UTR overlapping region of lds and dsx also generates piRNAs from both strands.


