
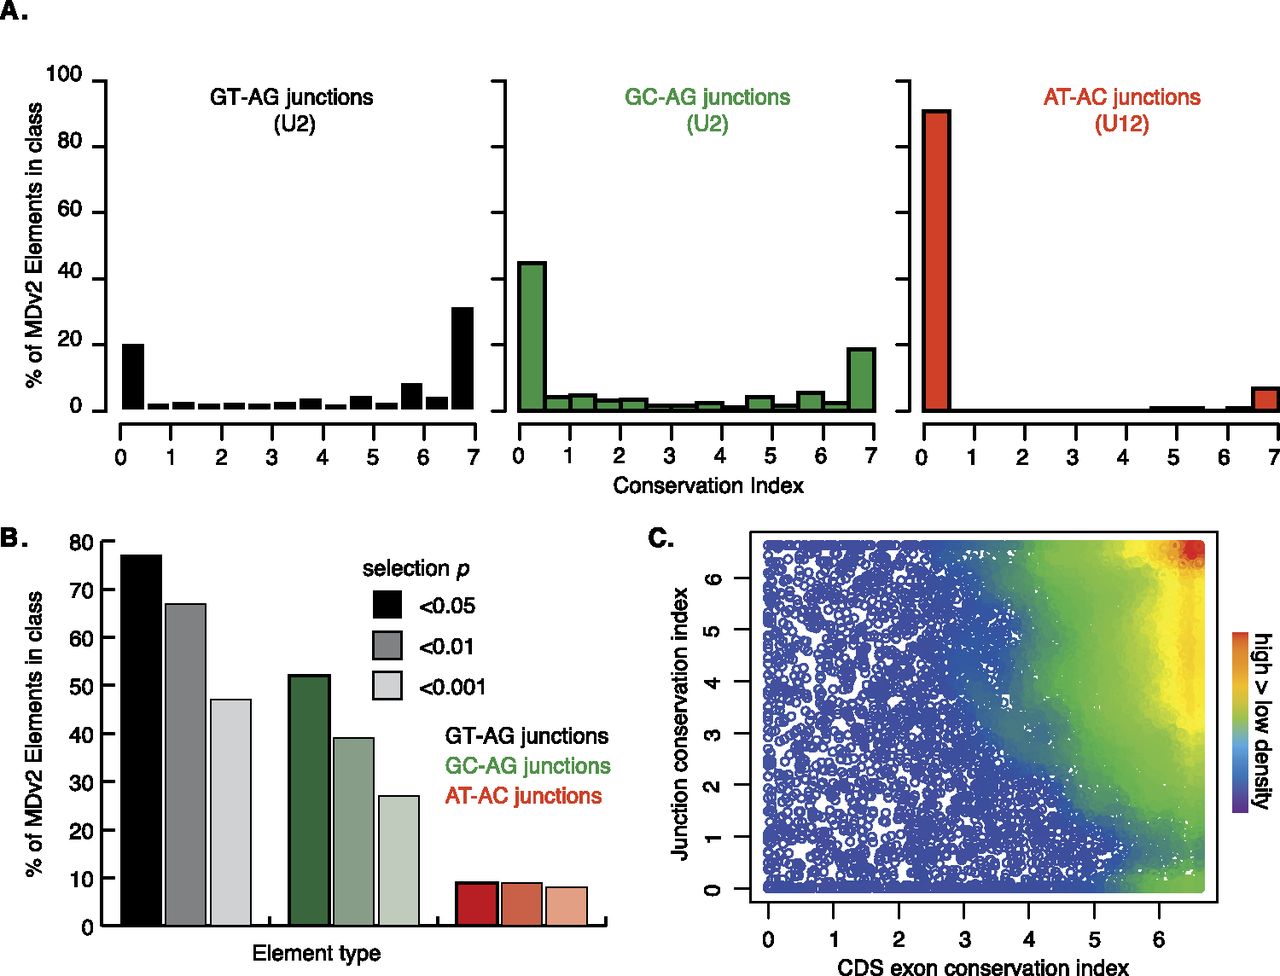
RNA splicing conservation. (A) Frequency of CI scores for MDv2 annotated GT-AG (black) and GC-AG (green) splice junctions (recognized by U2 spliceosomes) and AT-AC splice junctions (red) (recognized by U12 spliceosomes). (B) Frequency of probabilities that the exon conservation indexes for GT-AG junctions (shades of black), GC-AG junctions (shades of green), and AT-AC junctions (shades of red) were similar to intergenic regions (Supplemental Table S13). The P-value column order for each element is shown in the key (0.05, 0.01, and 0.001 from left to right for each element). (C) Density plot illustrating the relationship between the mean CDS exon and junction conservation index scores within a gene.


