
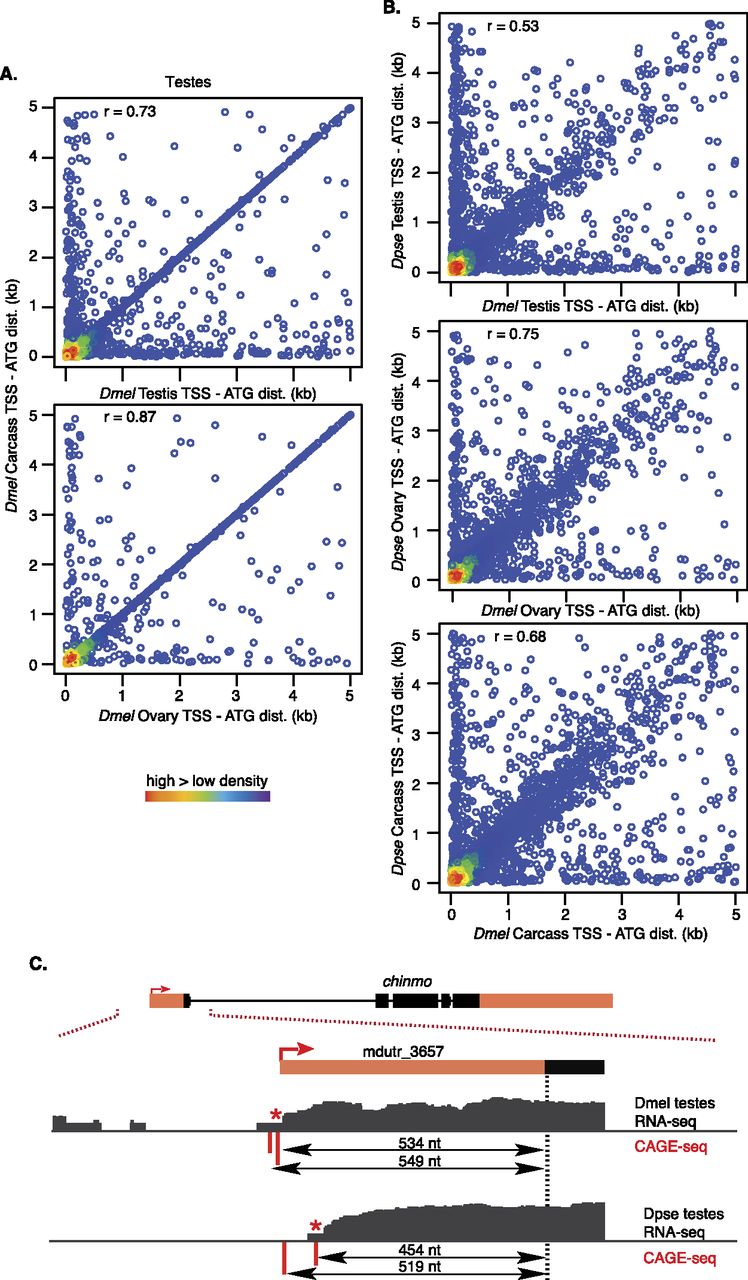
Transcription start site position. (A,B) Density plot (color scale) of distance between translation start (encoding the first AUG of the open reading frame) and CAGE site between D. melanogaster tissues or species (see Supplemental Files S1–S8 for browser-ready CAGE data files). (C) CAGE site examples for the chinmo locus expression in testes. UTR (orange fill) and CDS exons (black), annotated TSS (red arrow), CAGE sites (red), and RNA-seq read density (black) do not align, but there is clear evidence of these structures from RNA-seq (black). Aligned and presumably orthologous CAGE sites (red asterisk) are shown. Double-ended arrows indicate distance from CDS to the CAGE sites.


