
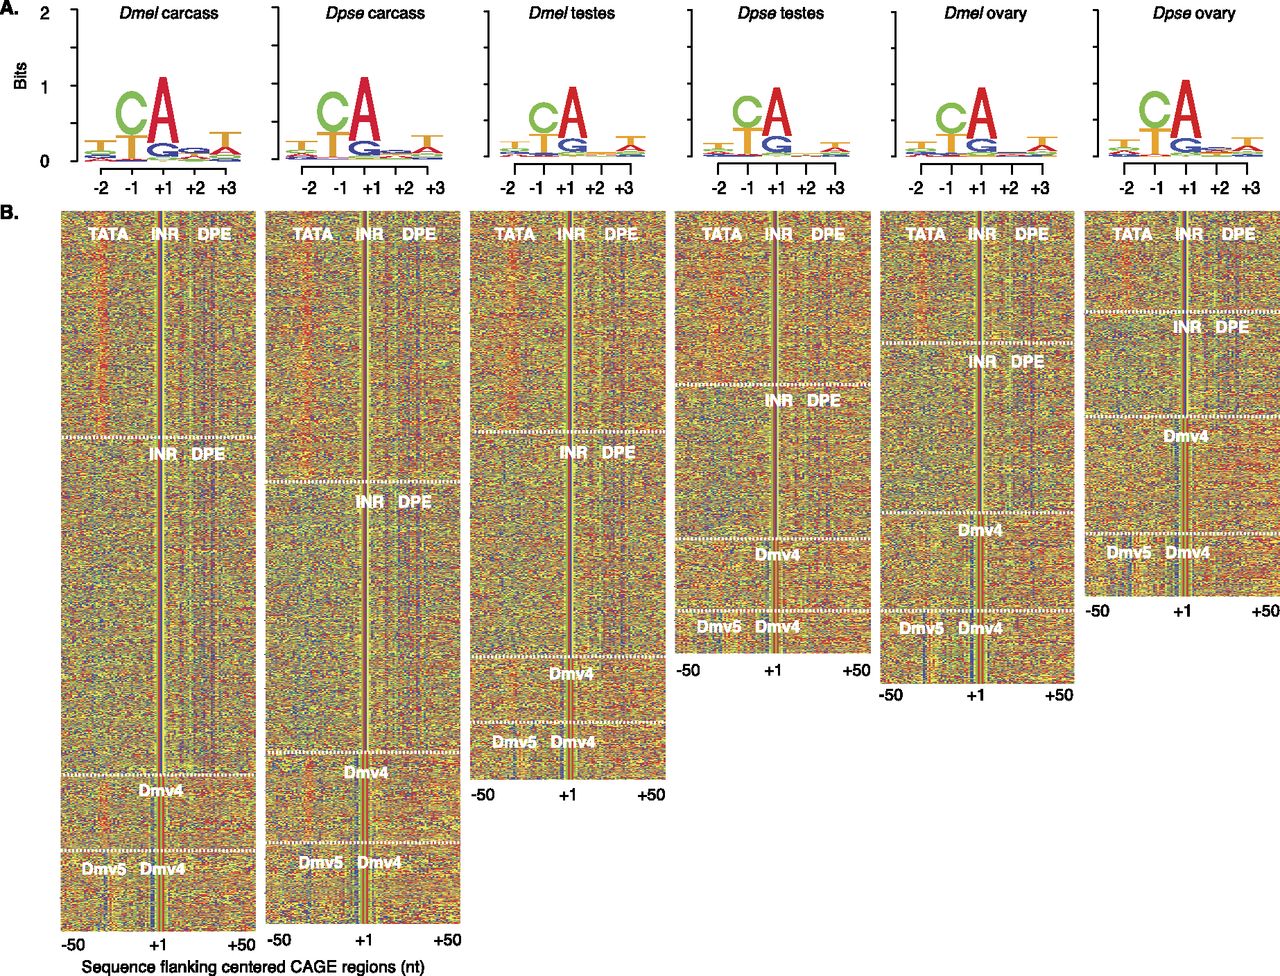
Figure 4.
Transcription start site motifs. (A) Sequence logos centered on the “CA” motif (where A = +1 of CAGE sites) derived from the peak distribution of CAGE reads from each D. melanogaster and D. pseudoobscura sample. CAGE-seq used the same mRNA samples as RNA-seq (Fig. 1C). (B) K-means clustering of sequences flanking the CAGE site sequences (A, red; C, green; G, blue; T, orange). Promoter regions lacking obvious structure are not shown. Regulatory motifs (white text) in each cluster are indicated (delineated by white dashed lines).


