
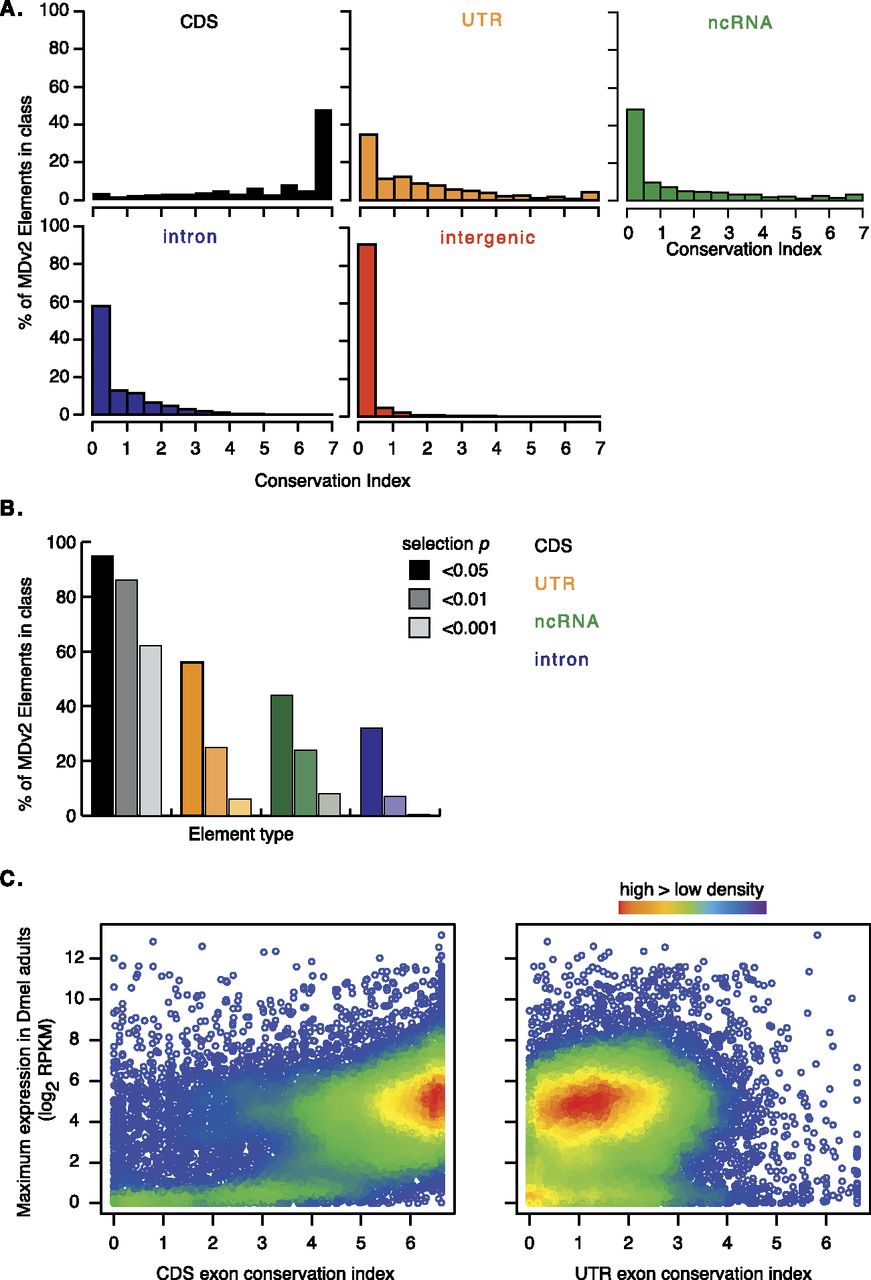
Exon conservation. (A) Frequency of conservation index (CI) scores for MDv2-annotated CDS exons (black), UTR exons (orange), ncRNA exons (green), introns (blue), and intergenic regions (red). (B) Frequency of probabilities that CI scores for CDS exons (shades of black), UTR exons (shades of orange), NC exons (shades of green), and introns (shades of blue) were similar to those of intergenic regions. The P-value is shown in the key (0.05, 0.01, 0.001 from left to right for each element) (Fig. 1E; Supplemental Tables S6–S10). (C) Density plots illustrating the relationship between CDS and UTR exons’ CI and maximum element gene-level expression values (FPKM) in D. melanogaster adults.


