
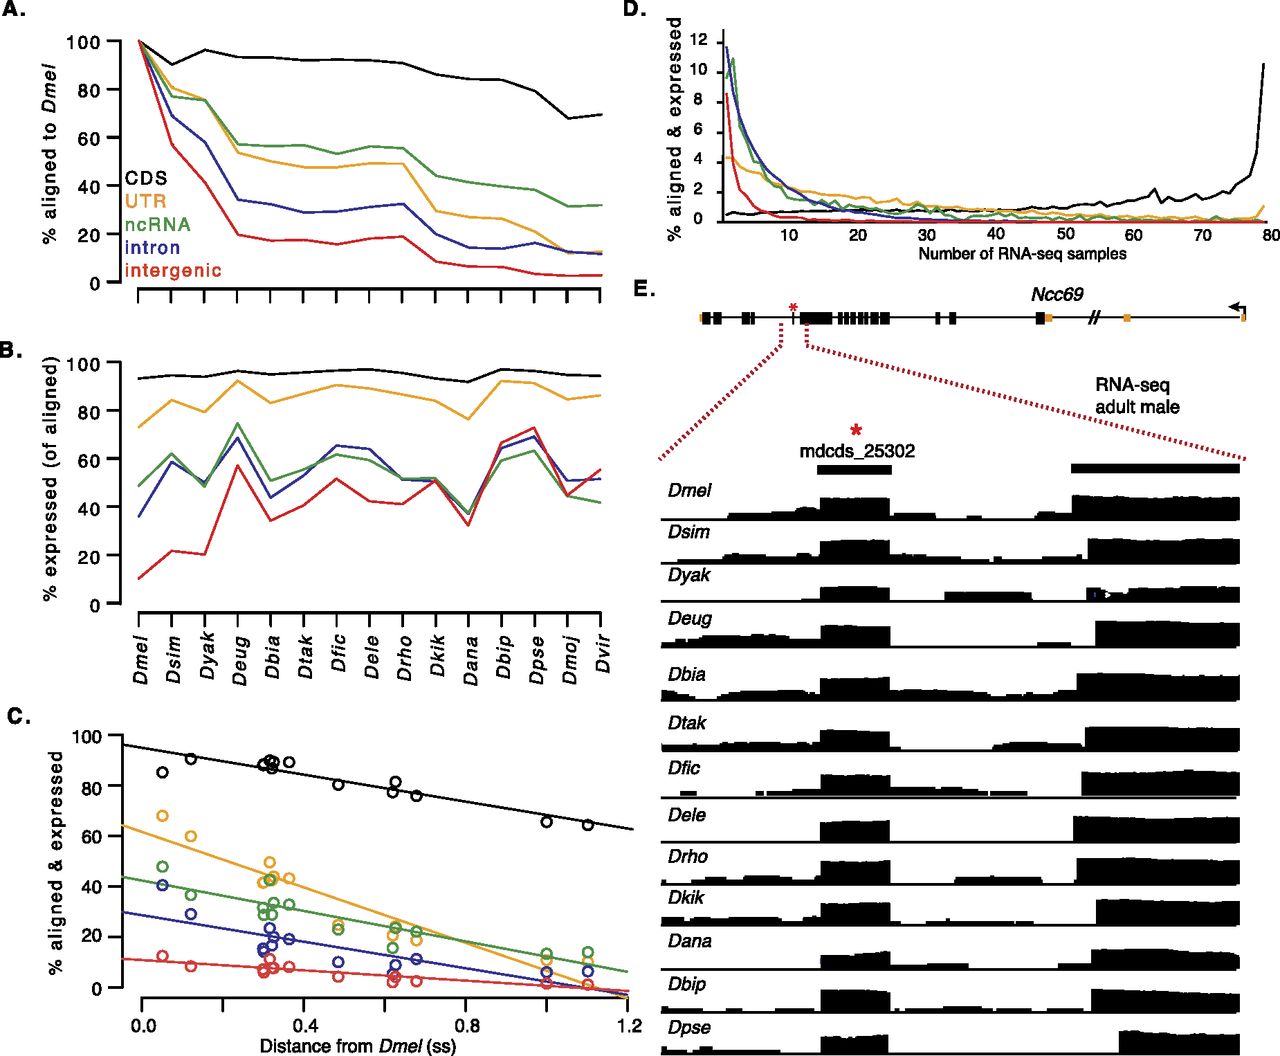
Exon validation. (A) Percentage of MDv2-annotated CDS exons (black), UTR exons (orange), ncRNA exons (green), introns (blue), and intergenic regions (red) that align in the indicated genome. (B) Percentage of aligned regions expressed (95% element coverage). (C) Percentage of aligned and expressed for each element type in each non-melanogaster species, plotted against phylogenetic distance from D. melanogaster (Fig. 1E; Supplemental Tables S6–S10). (D) The distribution of aligned and expressed features in RNA-seq samples. (E) Gene model for Ncc69 showing transcription start (arrow), UTR regions (orange fill), CDS (black fill), and introns (black line). Expression of MDv2 exon mdcds_25302 (red asterisk) and flanking region (upstream 300 bp and downstream 150 bp) in 13 species. Log2 scale RNA-seq coverage (arbitrary scale for illustration) in whole adult males of the indicated species.


