
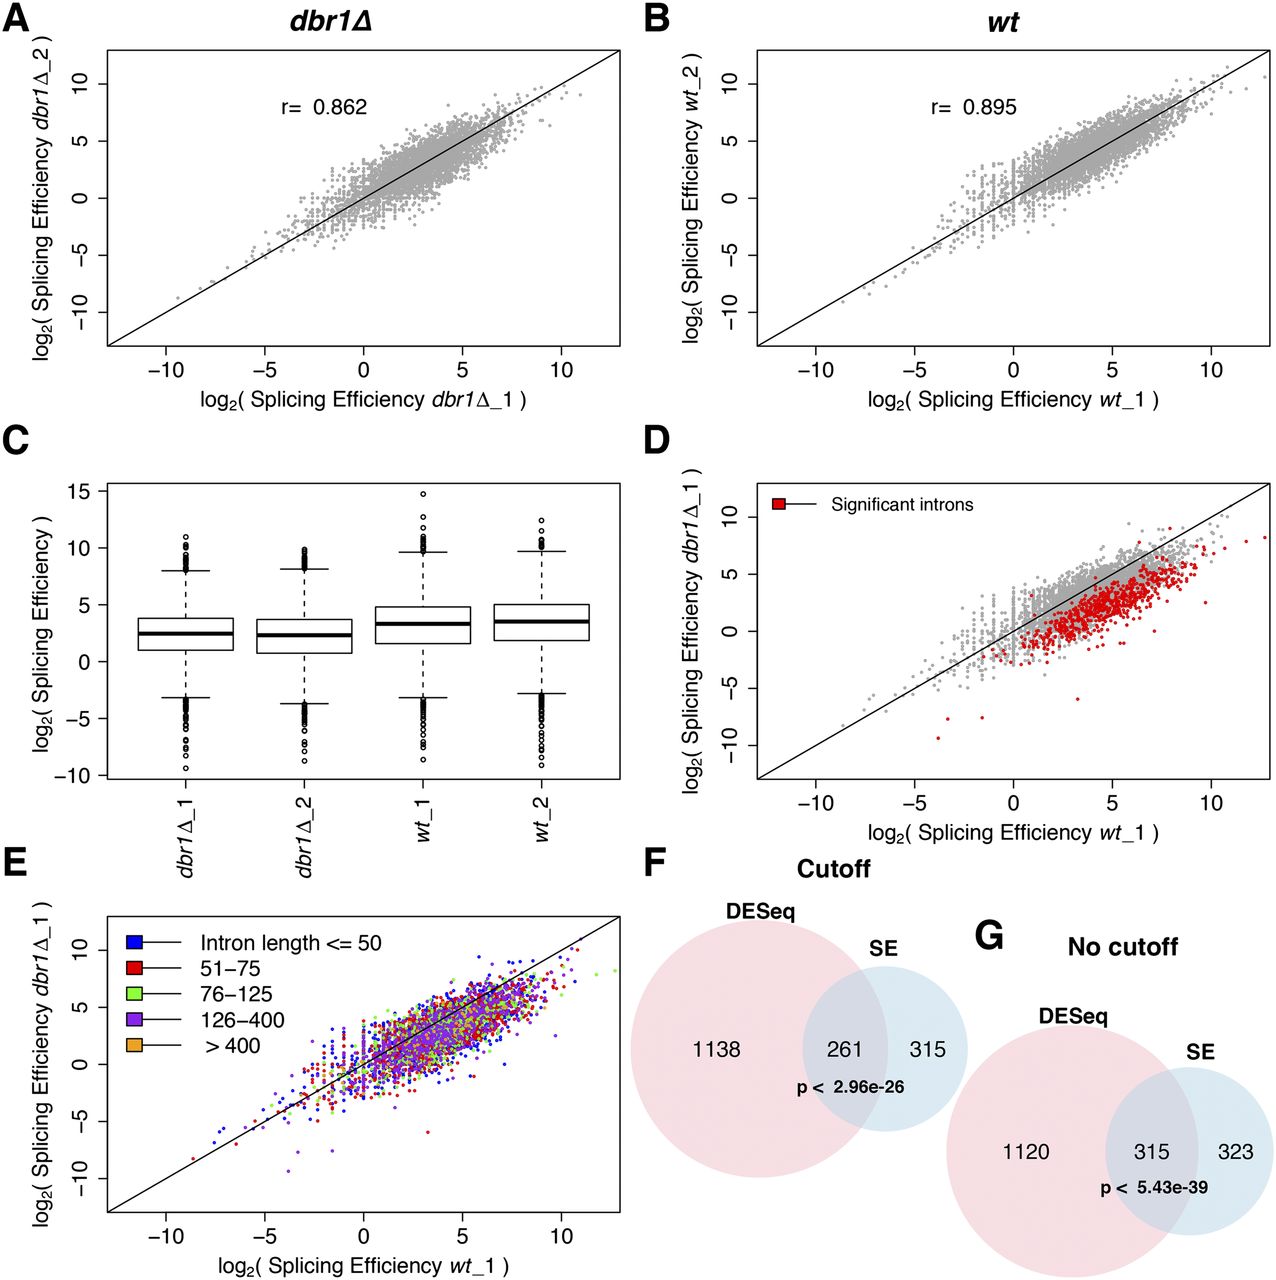
Splicing efficiency is decreased in dbr1Δ cells. (A,B) Correlation of splicing efficiency (SE) between biological replicates in dbr1Δ (A) and wild type (B). Each dot represents one of 5361 introns; (r) Pearson’s correlation coefficient. (C) Box plot showing SE in dbr1Δ and wild-type cells (P < 2.2 × 10⁻¹⁶, Wilcoxon rank sum test). (D) Comparison of SE between dbr1Δ and wild type. (Red) 638 introns showing significant changes in SE (CMH test; Q < 0.05). (E) As in D but with introns binned according to their size as indicated in color legend. (F,G) Overlap between introns with lower SE and introns with higher expression (DESeq), both with and without fold-change cutoff. The indicated P-values for overlaps are based on a hypergeometric test.


