
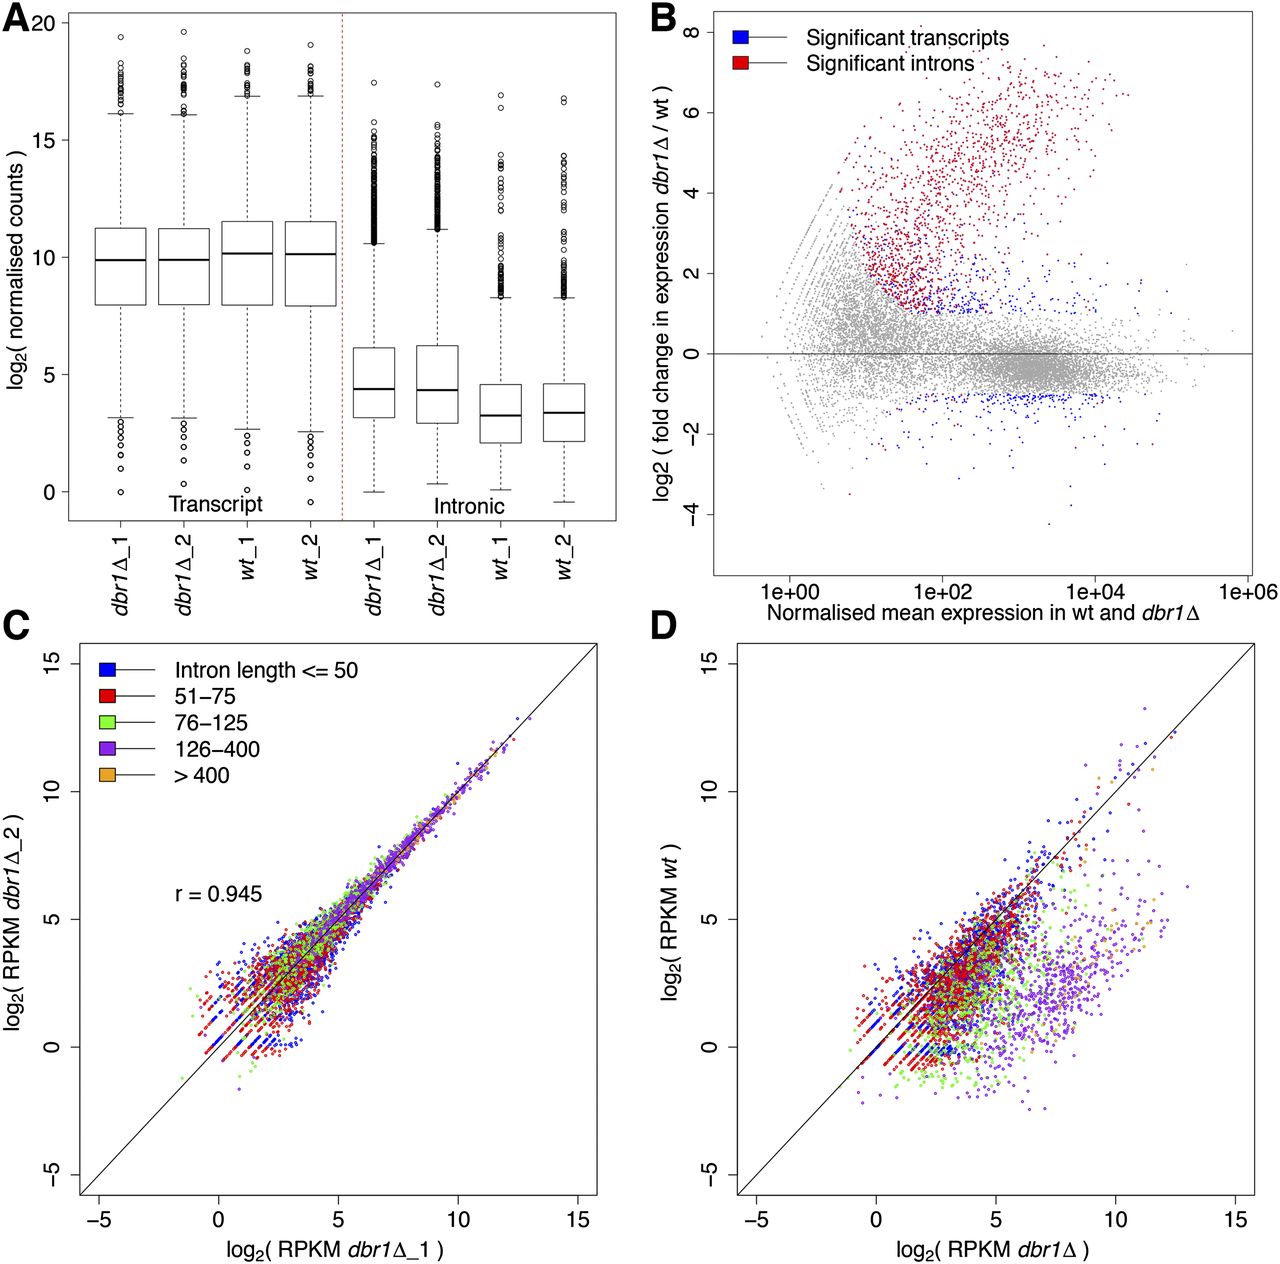
Increased, length-biased intronic expression in dbr1Δ cells. (A) Box plot showing transcript and intronic expression in dbr1Δ and wild-type cells. Intronic expression is significantly higher in dbr1Δ (P < 2.2 × 10⁻¹⁶, Wilcoxon rank sum test). (B) MA plot showing differentially expressed introns (red) and transcripts (blue) (DESeq; adjusted P < 0.05 and absolute fold change > 2). (X-axis) Mean of normalized counts. (C) Reproducibility of intronic expression between dbr1Δ biological replicates (each dot represents one of 5361 introns; [r] Pearson’s correlation coefficient). Introns were binned according to length as indicated in color legend. (D) Comparison of intronic expression between dbr1Δ and wild type with introns binned as in C. Only one comparison is shown; the other biological replicates produced the same trends. The higher intronic expression in dbr1Δ cells shows a strong length bias (P < 2.2 × 10⁻¹⁶, Wilcoxon rank sum test).


