
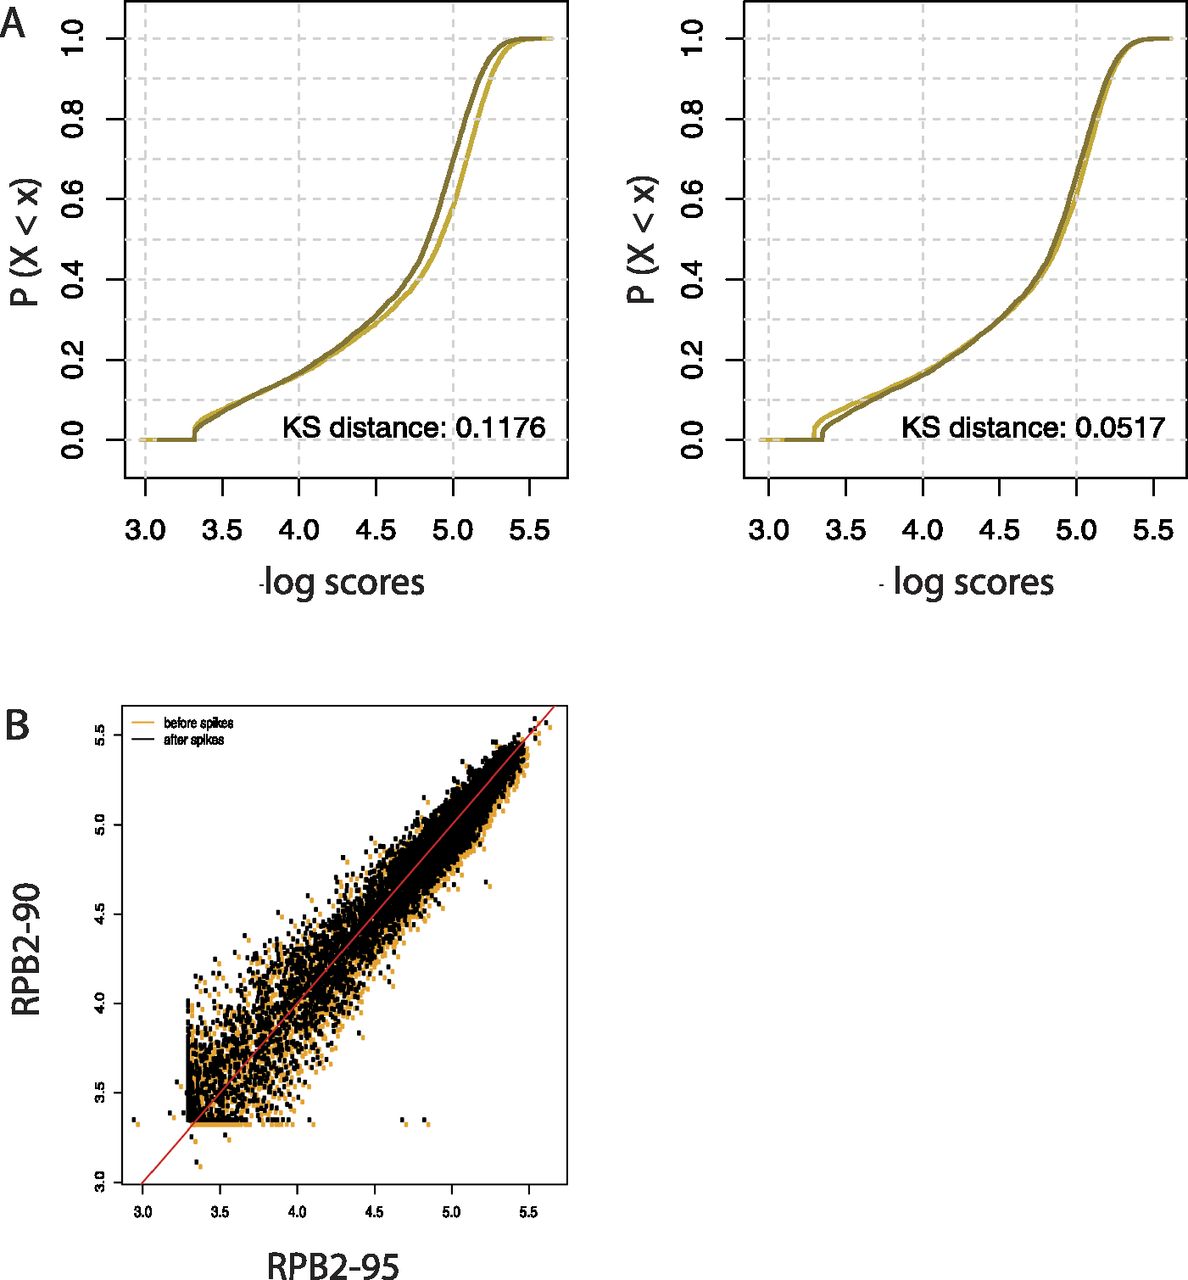
Figure 6.
Spike adjustment improves the similarity of two Pol II ChIP-seq replicate experiments. (A) ECDFs of the scores of the indicated distributions. Preliminary scores were computed around the TSS (±250 bp) with the SPP software. The KS distance is shown at the bottom right of each panel. (Dark line) RPB2_90 sample; (light line) RPB2_95 sample. (B) Scatter plots showing the relation between the RPB2_90 and RPB2_95 scores before (orange dots) and after (black dots) spike adjustment. The red line corresponds to x = y.


