
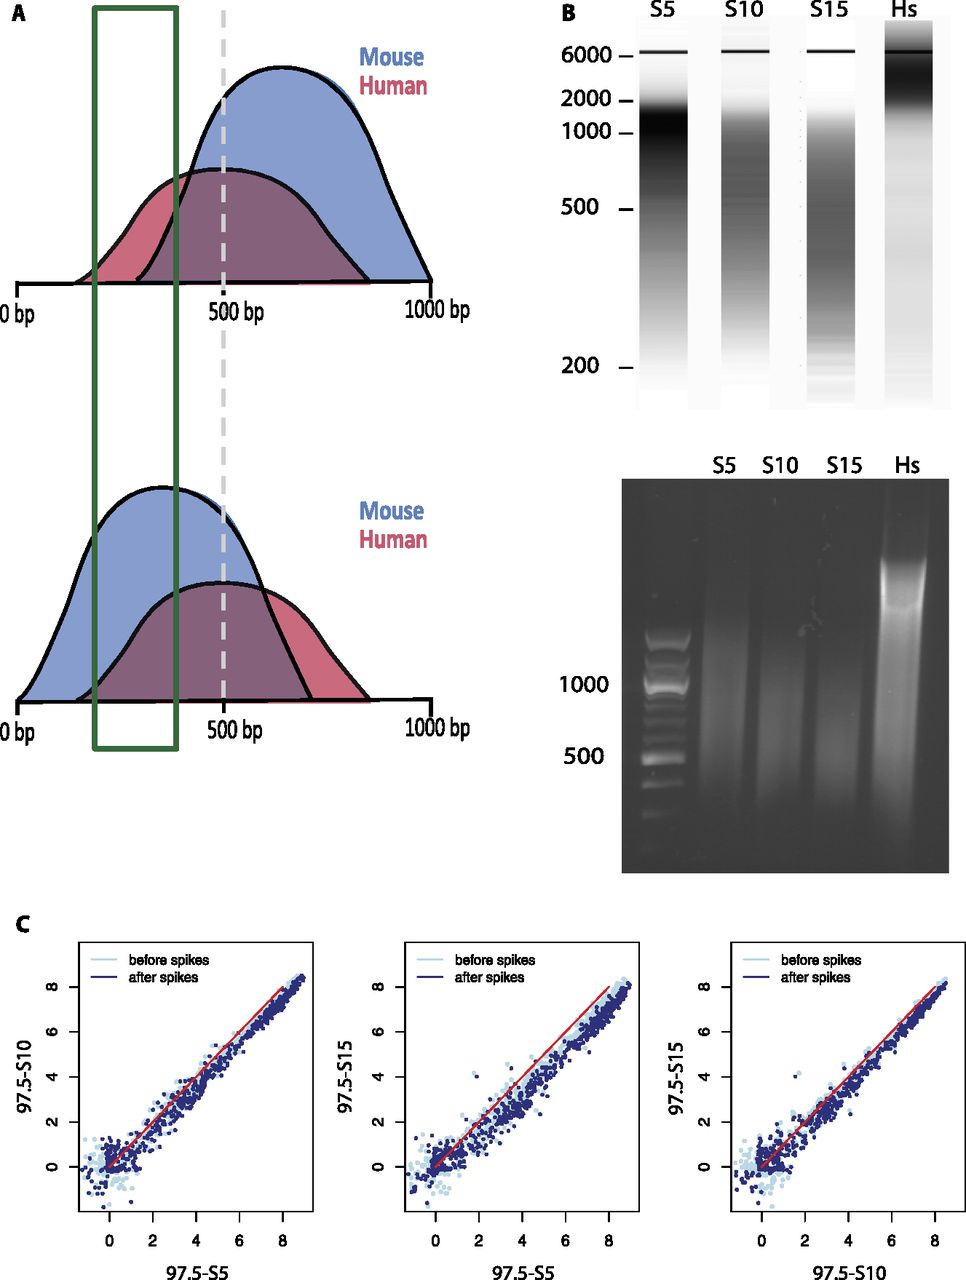
The SAP tolerates sample-to-sample differences of average chromatin fragment length. (A) Illustration of two hypothetical cases. (Top) The mouse chromatin sample (blue) is sonicated to an average size >500 bp; (bottom) the average size is <500 bp. The human chromatin (red) used to spike the samples is from the same batch and has an average size of 500 bp. Size selection from 200 to 400 bp is expected to result in a smaller proportion of mouse chromatin in the first case than in the second case. (B) Size representation obtained by fragment analyzer (top) and 1% agarose gel electrophoresis (bottom) of three mouse chromatin samples sonicated for 5 (S5), 10 (S10), and 15 (S15) cycles of 10 sec, as indicated above the lanes. The position of DNA size markers (in bp) is indicated on the left. The last lane shows the human chromatin spike sample. (C) Scatter plots showing the relation of mouse Pol III loci scores before and after spike adjustment for the three pairs of samples sonicated for different amounts of time. The Pearson and Spearman correlations before and after spike adjustment were as follows: 97.5_S5 versus 97.5_S10, 0.9927→0.9935 and 0.9678→0.9653; 97.5_S5 versus 97.5_S15, 0.9900→0.9885 and 0.9728→0.9663; and 97.5_S10 versus 97.5_S15, 0.9917→0.9926 and 0.9626→0.9636.


