
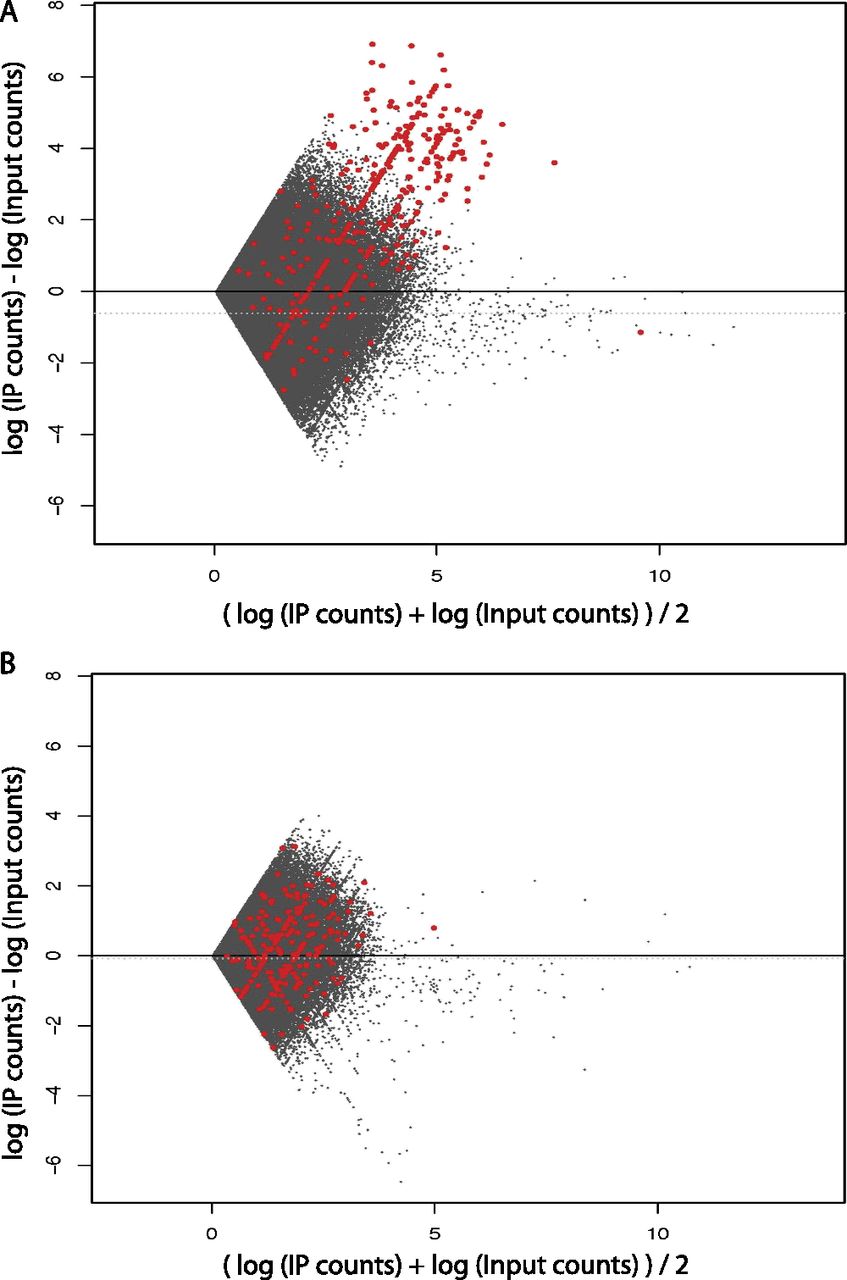
Figure 3.
The spike chromatin can be used for quality control. Mean-difference scatter plot of human Pol III genome bin counts (in log scale). Red dots indicate genomic bins that overlap with Pol III loci. The genome was binned into 400-bp bins (corresponding to a typical Pol III gene length [∼100 bp] extended by 150 bp in both the upstream and downstream directions). Zero-count bins were filtered out prior to plotting. (A) An example of a good-quality sample (90_R1). (B) An example of a poor-quality sample (97.5_P1).


