
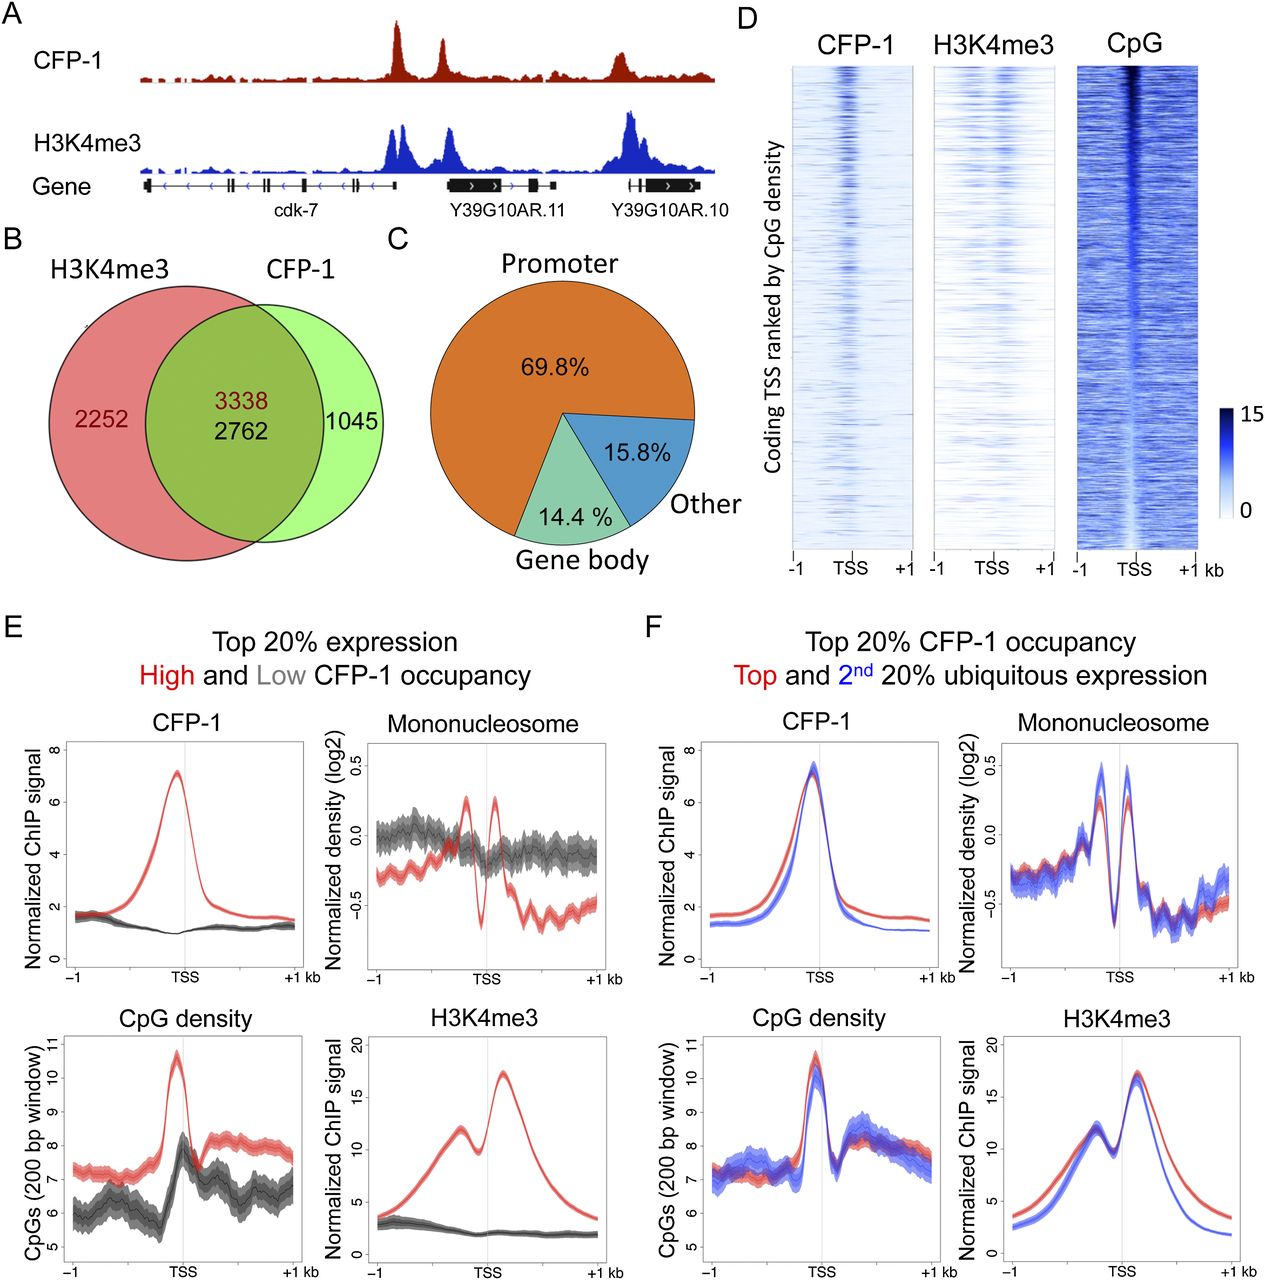
C. elegans CFP-1 is targeted to CpG-rich promoters marked by H3K4me3. (A) A representative screen shot for the distribution of CFP-1 (red) and H3K4me3 (blue) normalized ChIP signals in late embryos. (B) Venn diagram showing the overlap between CFP-1 and H3K4me3 ChIP ChIP-seq peaks. Numbers in the overlap region are not equal because single peaks in one data set may overlap more than one peak in the other data set. (C) Percentage of CFP-1 peaks overlapping promoter regions (orange; ±500 bp of coding TSSs) (Chen et al. 2013; Kruesi et al. 2013), gene bodies (green), and the remaining genomic regions (blue). (D) Signal distributions for CFP-1, H3K4me3, and CpG density plotted in 2-kb windows centered by coding TSSs identified in Chen et al. (2013) in heat maps ranked by the density of promoter CpGs. The color scheme shows the scale (0–15) for the indicated signal. (E) Plots of CFP-1 ChIP signal, CpG content, mononucleosome pattern, and H3K4me3 signal across promoters of active ubiquitous genes in the top 20% of expression with high (red, top 20%), or low (dark gray, bottom 20%) CFP-1 occupancy. (F) Plots of CFP-1 ChIP signal, CpG content, mononucleosome pattern, and H3K4me3 ChIP signal across ubiquitous promoters highly targeted by CFP-1 (top 20%) and with high (red, top 20%) or low (blue, second 20%) expression levels. All plots display the indicated features in 2-kb windows centered at TSSs. Lines show mean signal, darker filled areas show standard error, and lighter filled areas are 95% confidence intervals.


