
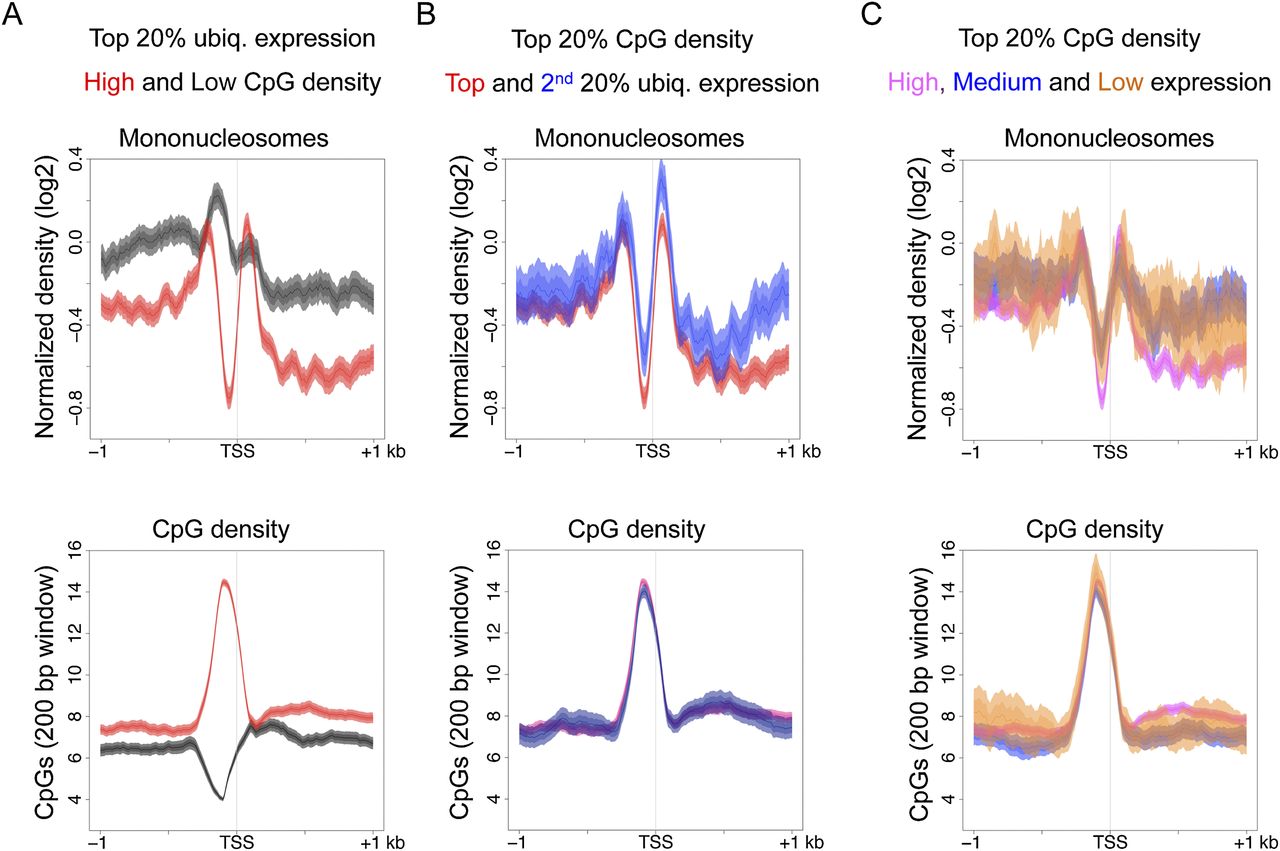
A promoter harboring a CpG dense region is associated with nucleosome depletion in C. elegans. (A) Plots of mononucleosome and CpG distributions across promoters of ubiquitously expressed genes in the top 20% of expression band, separated by high CpG density (red, top 20%) or low CpG density (dark gray, bottom 20%). (B) Mononucleosome and CpG distributions were analyzed for ubiquitously active promoters within 20% of CpG density (protein coding promoters) and separated into the top 20% (red) or second 20% (blue) of expression. (C) The distribution of mononucleosomes and CpGs across promoters with the top 20% CpG density separated into those with high (top 20%, pink), medium (middle 20%, blue), or low/no expression (bottom 40%, orange). Lines show mean signal, darker filled areas show standard error, and lighter filled areas are 95% confidence intervals.


