
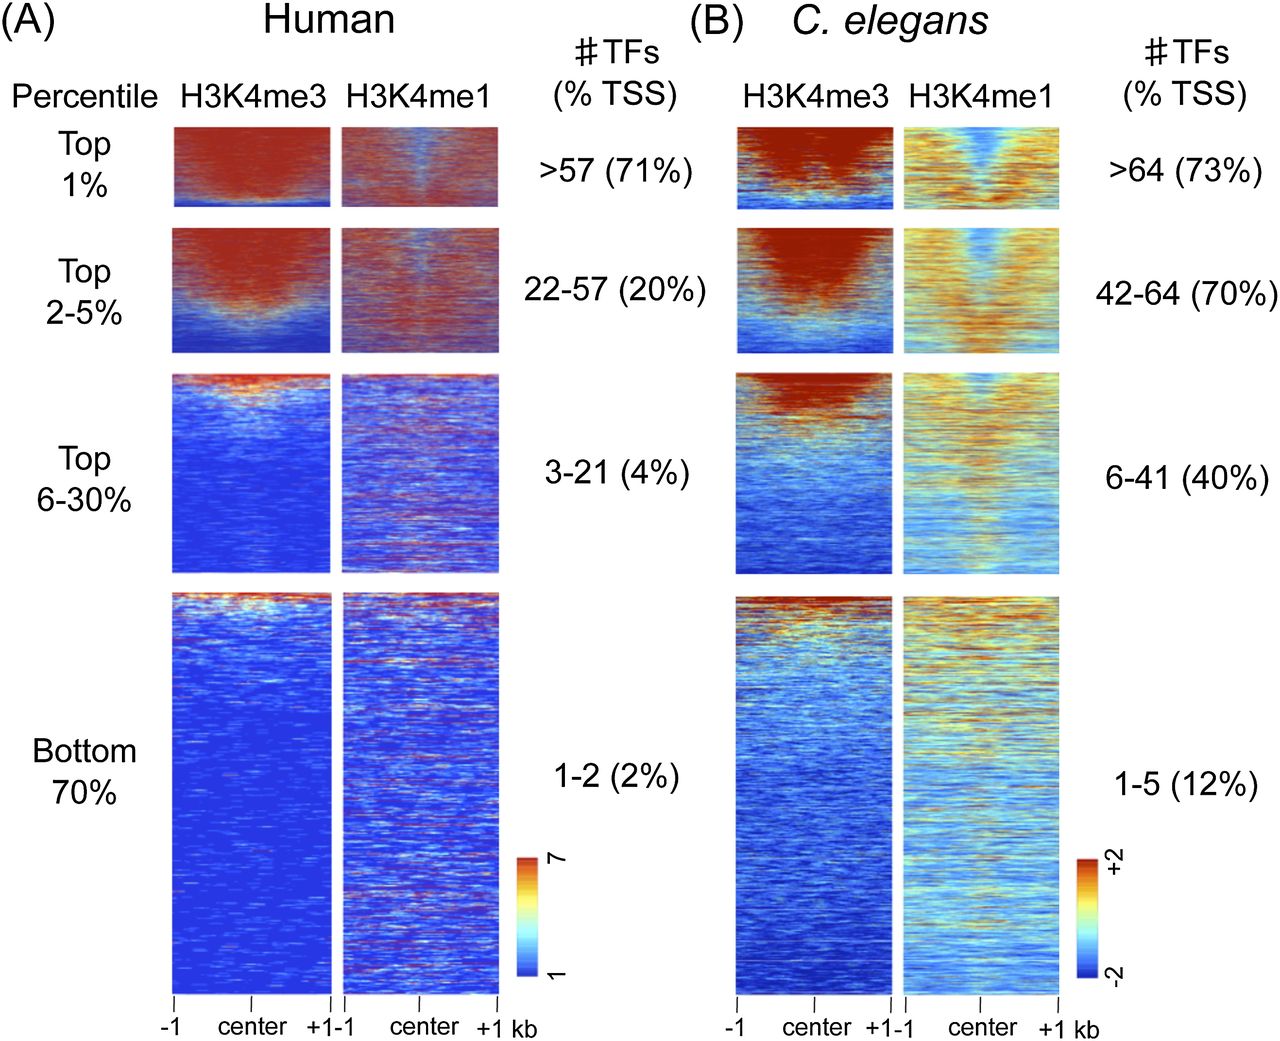
HOT regions display promoter features. H3K4me3 and H3K4me1 signals plotted at the centers of core TF overlap regions ranked by the indicated percentile of TF occupancy in humans and C. elegans. (A) For human TF overlap regions, 7419 (top 1%), 30, 945 (top 2%–5%), a random selection of 100,000 of 241,975 (top 6%–30%), and 456,812 (bottom 70%) regions are plotted. (B) For C. elegans TF overlap regions, 376 (top 1%), 1429 (top 2%–5%), 9721 (top 6%–30%), and 23,536 (bottom 70%) regions are plotted. In each TF overlap band, the number of TFs and the percentage of TF core midpoints ±500 bp of a TSS are indicated. Scales show linear (human) or log2 (C. elegans) input normalized signal ranges.


