
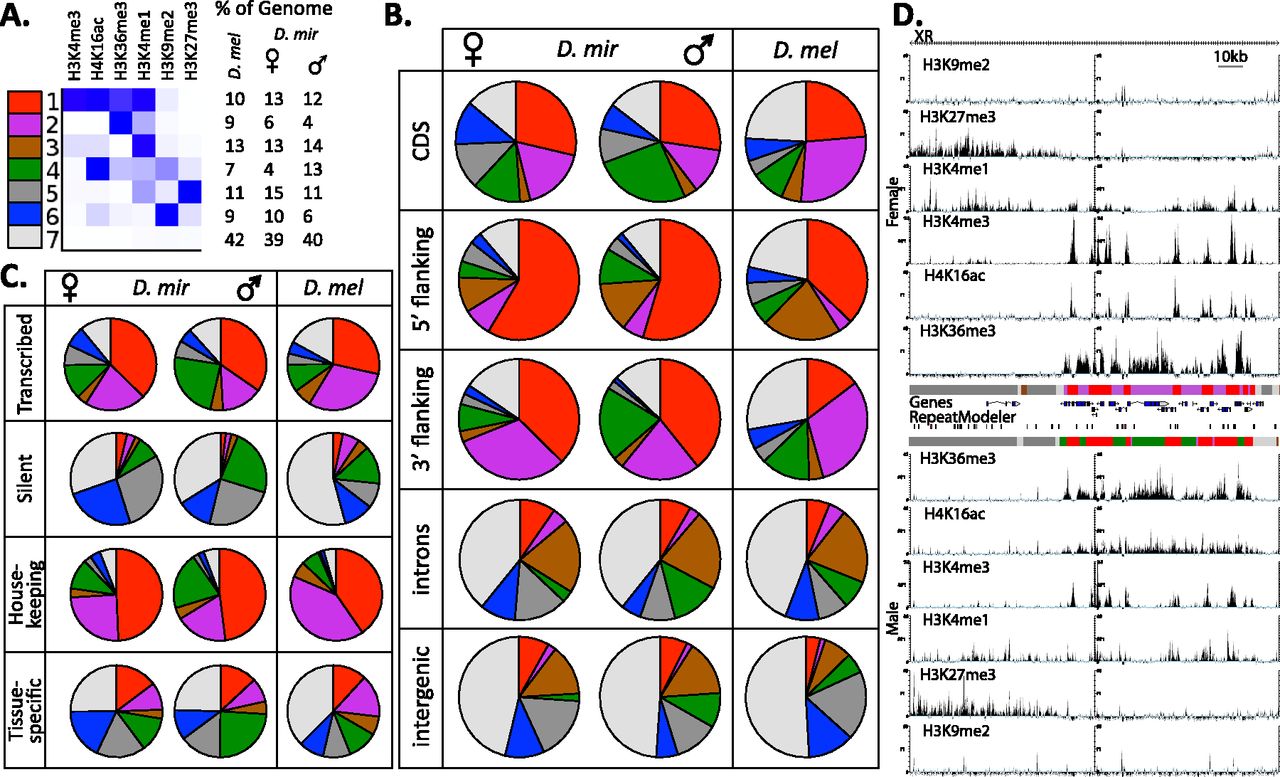
Figure 2.
The chromatin landscape of D. miranda and D. melanogaster. (A) A model of prevalent chromatin states found in D. melanogaster and genomic coverage of chromatin states in D. melanogaster and male and female D. miranda. (B) Coverage of chromatin states in different categories of the genome. The 5′ and 3′ flanking regions refer to ±1 kb upstream of and downstream from the coding sequence (CDS). (C) Coverage of chromatin states in expressed and silent genes, and expressed genes categorized by their breadth of expression (housekeeping genes vs. tissue-specific genes as measured by the tissue-specificity index tau). (D) Example of chromatin profiles across the D. miranda genome.


