
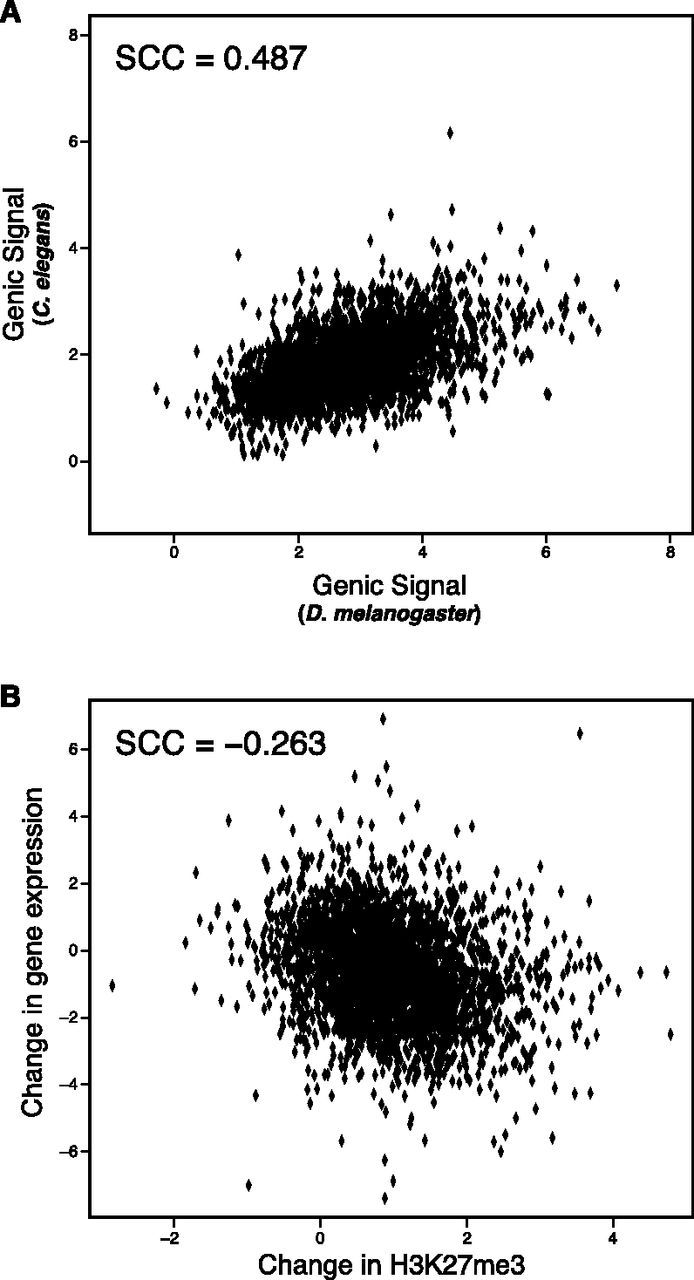
Figure 2.
Conservation of H3K27me3 extends to Caenorhabditis elegans. (A) Substantial conservation of H3K27me3 between D. melanogaster and C. elegans. As in Figure 1A, each dot represents a gene, with the x-axis position corresponding to log H3K27me3 signal in D. melanogaster and the y-axis position corresponding to log H3K27me3 signal in C. elegans. The Spearman correlation coefficient is 0.487 between them. (B) Change in H3K27me3 levels is associated with changes in gene expression. Each dot is an individual single-copy orthologous gene, where the x-axis is the change in log H3K27me3 and the y-axis is the change in log expression. The overall Spearman correlation coefficient is −0.263.


