
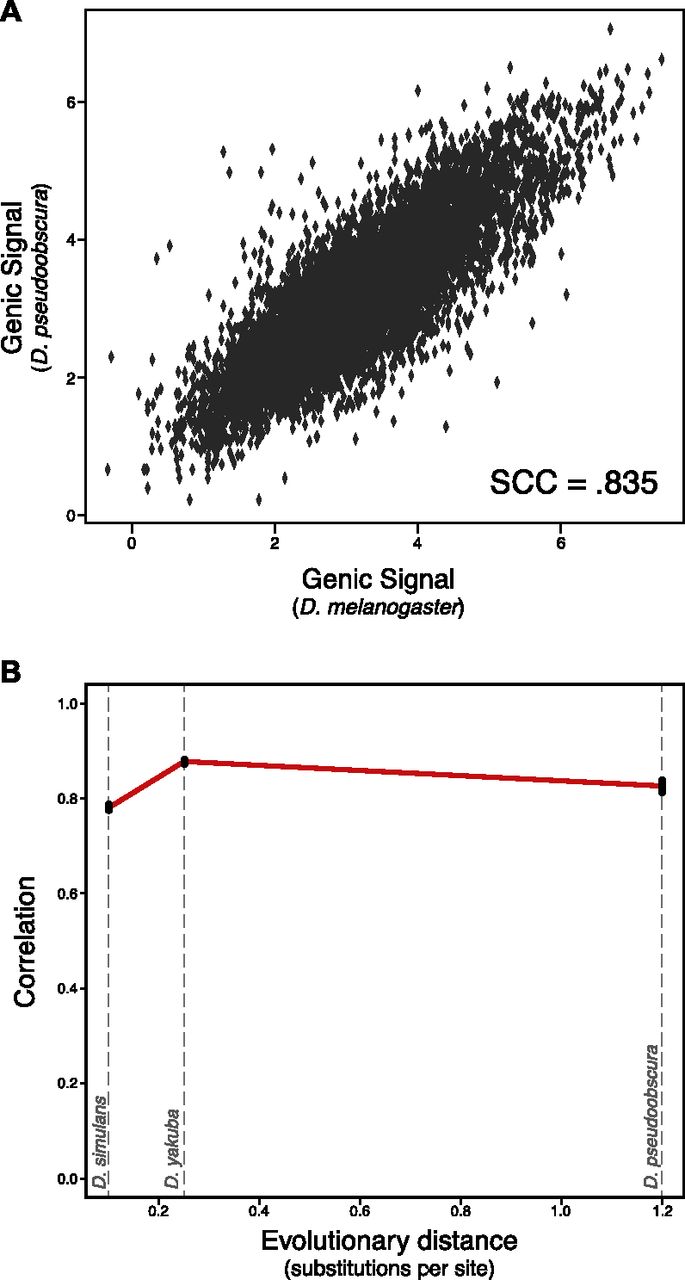
Strong conservation of H3K27me3 in Drosophila orthologs. (A) Example graph of orthologous gene conservation for the comparison of melanogaster to pseudoobscura. Each dot is a single-copy orthologous gene pair, and the position on the x-axis represents the log melanogaster genic signal (see Methods), while the y-axis represents the log pseudoobscura genic signal; each is the mean of two experiments. The overall rank correlation coefficient between species is 0.835. (B) Overall trend of single-copy ortholog conservation within Drosophila. Each point is the Spearman rank correlation of one pairwise between-species comparison, plotted against the evolutionary distance from Drosophila melanogaster (in substitutions per neutral site). Black bars represent bootstrapped 95% confidence intervals. From left to right the species are D. simulans (SCC = 0.781), D. yakuba (SCC = 0.878), and D. pseudoobscura (SCC = 0.835).


