
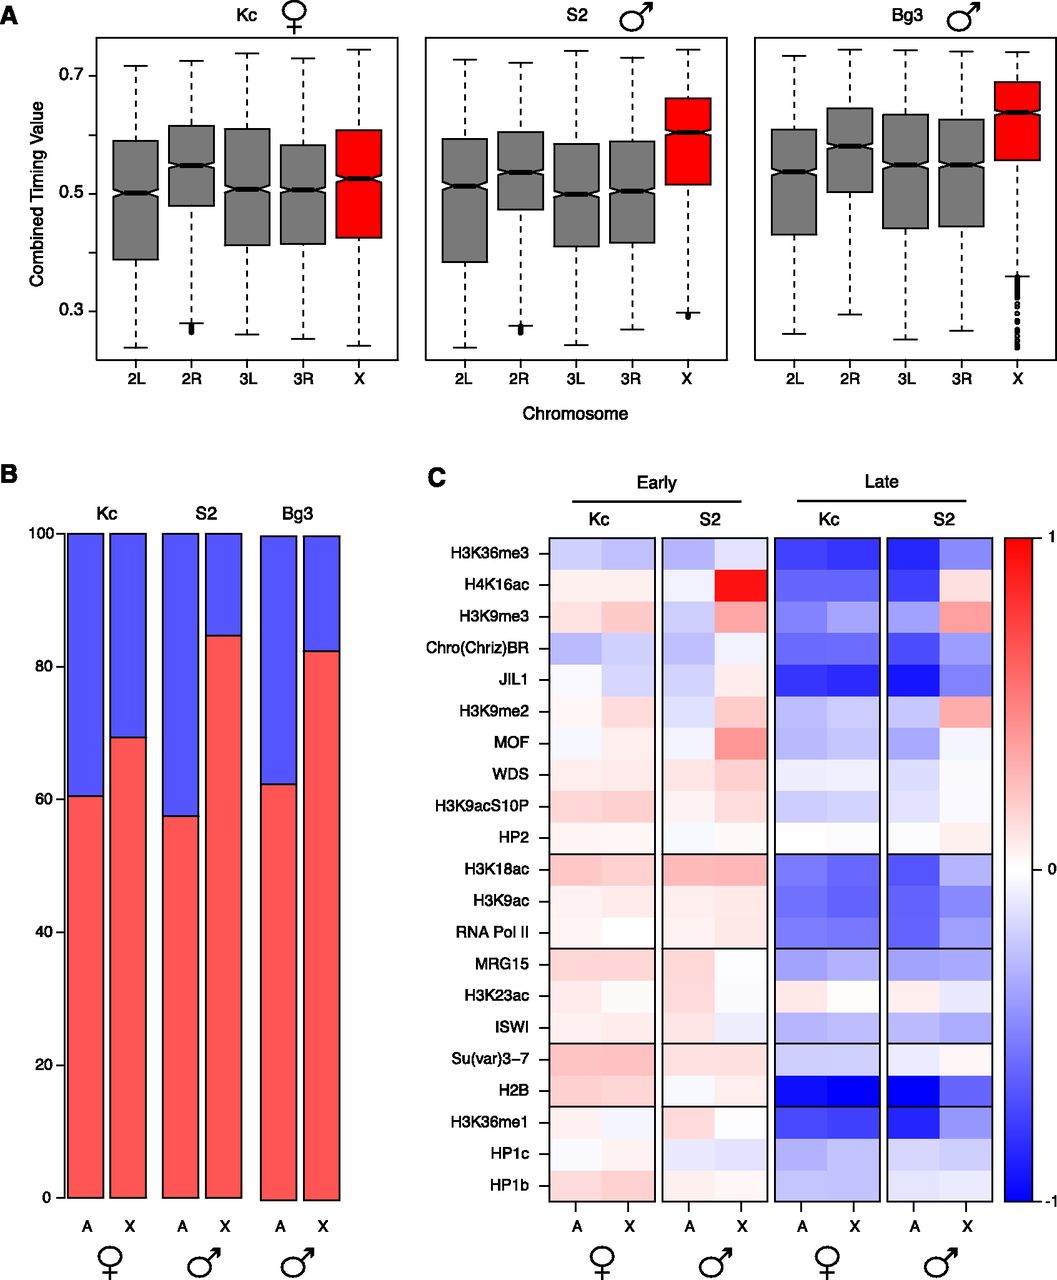
Differential replication timing of the male X chromosome. (A) Boxplots representing the distribution of timing values for each chromosome calculated in 10-kb bins. In the male cell lines, the X chromosome replicates significantly earlier than the autosomes (P-value < 2.2 × 10⁻¹⁶). (B) Distribution of early (red) and late (blue) replicating domains for both the autosomes and X chromosome in the three cell lines. (C) Heatmap representing the median enrichment score of chromatin marks and DNA-binding proteins found within early (left) and late (right) replicating domains on the X chromosome or the autosomes (A) in male (S2) or female (Kc167) cells. Red represents an enrichment of log2(1) or greater and blue represents a depletion of log2(1) or greater.


