
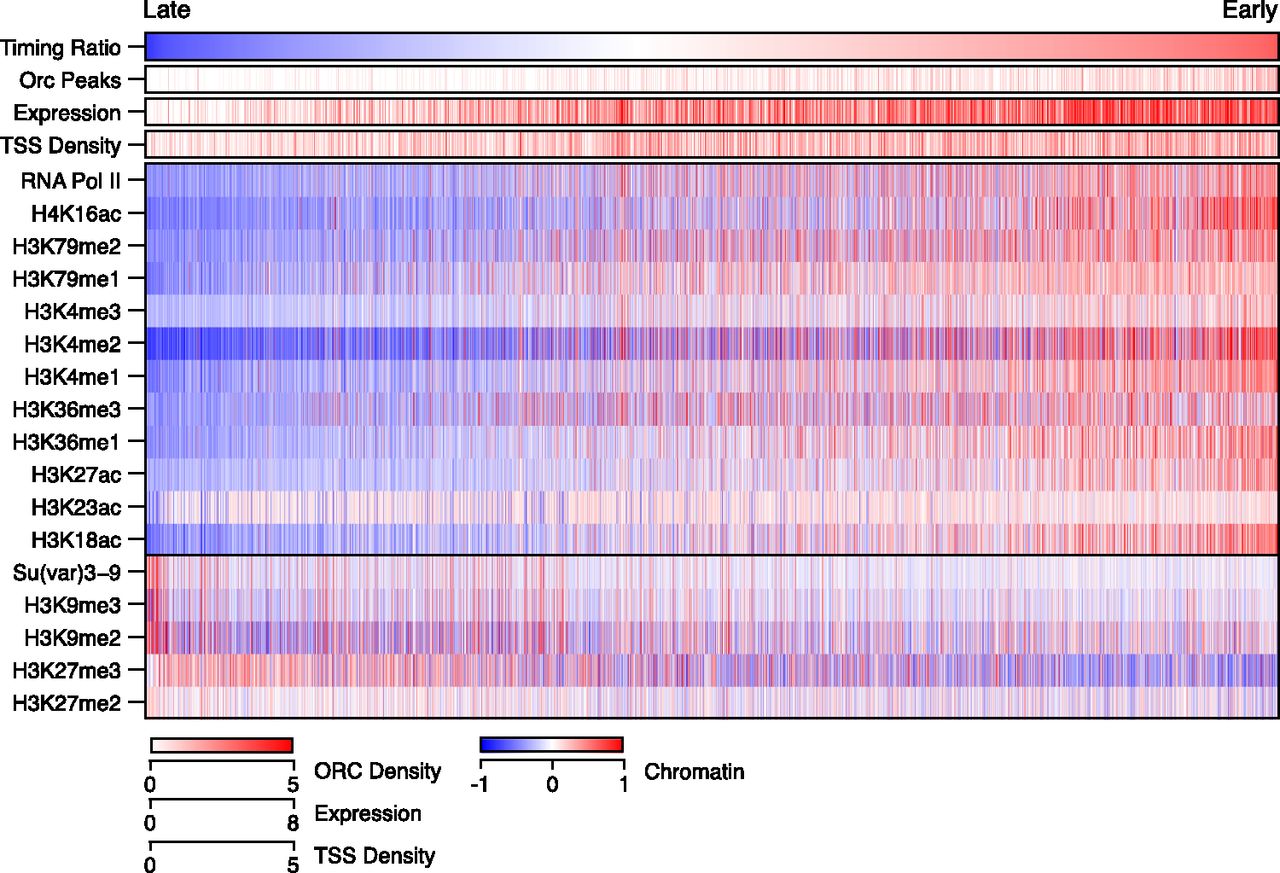
Figure 2.
Replication timing correlates with the chromatin landscape. The relative replication timing values from S2 cells were binned into 10-kb windows and ordered from late (left, blue) to early (right, red). Also plotted are normalized enrichments for gene expression, DNA-binding proteins, and histone modifications as well as ORC density and promoter density. Histone marks and DNA-binding proteins were ordered by row according to their genome wide co-association (determined by k-means clustering of genome-wide correlations, k = 2). Equivalent data for the other two cell lines are available in Supplemental Figure 4.


