

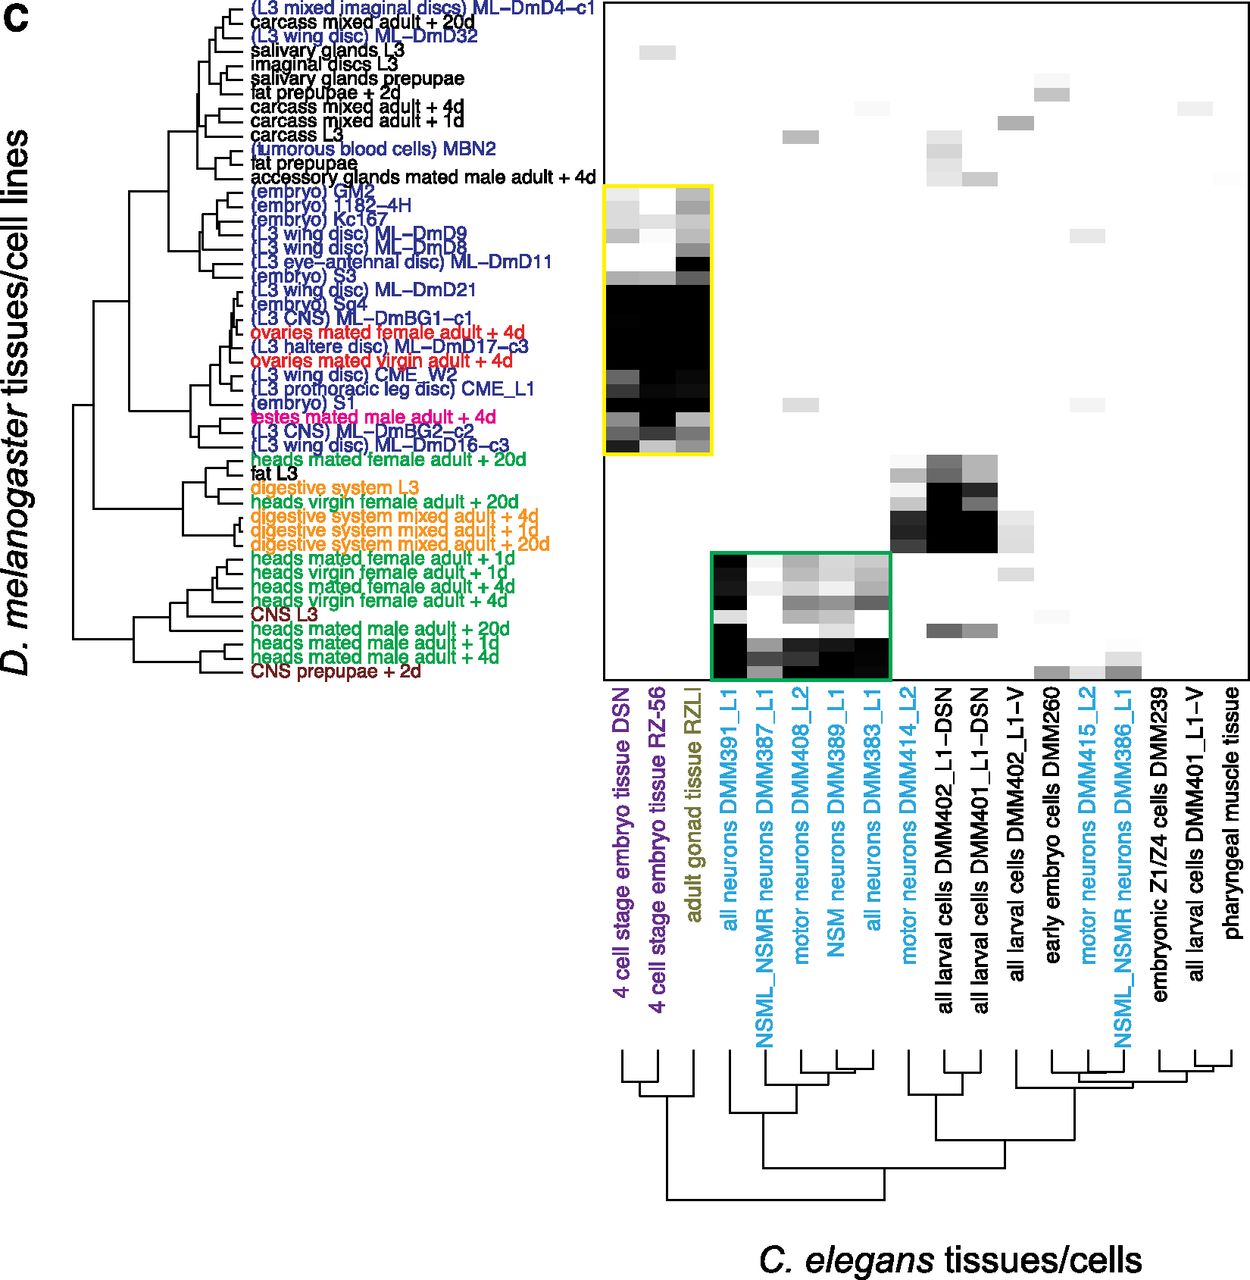
Comparison results of different developmental stages, tissues, cell lines, and dissected cells between D. melanogaster and C. elegans. Mapping scores shown in the heatmaps are –log10 transformed Bonferroni corrected P-values, which are calculated from the hypergeometric test in Figure 2B. (A) Comparison between D. melanogaster developmental stages and C. elegans tissues/dissected cells. (B) Comparison between D. melanogaster tissues/cell lines and C. elegans developmental stages. (C) Comparison between D. melanogaster tissues/cell lines and C. elegans tissues/dissected cells. Hierarchical clustering was applied to order the D. melanogaster tissues/cell lines and C. elegans tissues/dissected cells in A, B, and C. Tissues/dissected cells with similar origins and cell lines are marked with colors. For detailed information on the stage/tissue/cell labels, please refer to Supplemental Table S2.


