
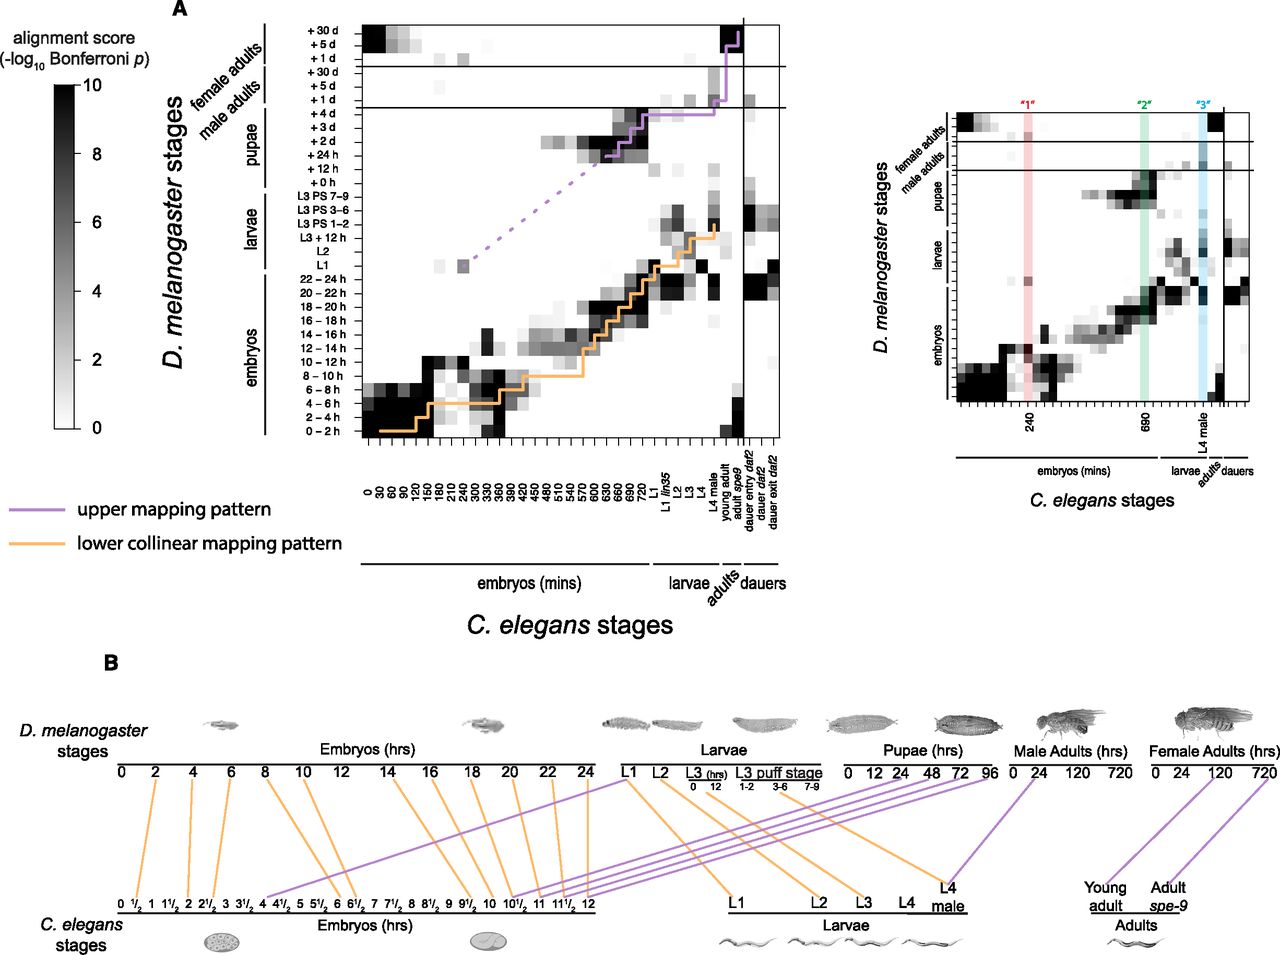
Comparison results of different developmental stages between D. melanogaster and C. elegans. Mapping scores shown in the heatmaps are –log10 Bonferroni corrected P-values, which are calculated from the hypergeometric test in Figure 2B. (A) Overall comparison of stages between species. The orange and purple stair-step lines were found by maximizing the sum of mapping scores of the stage pairs they pass through, to emphasize the two parallel collinear mapping patterns observed between D. melanogaster and C. elegans developmental stages. The red, green, and cyan shades mark the three two-to-one fly-worm stage mapping columns 1, 2, and 3 (inset, right). (B) A cartoon summary of main comparison results. Every orange or purple line corresponds to an upper-left corner in the stair-step line of the same color in A. For detailed information on the stage labels, please refer to Supplemental Table S2. (The stage images were modified with permission from FlyMove [Weigmann et al. 2003] by Dr. Christian Klämbt and from WormAtlas [http://www.wormatlas.org] by Dr. David H. Hall and Dr. Zeynep F. Altun.)


