
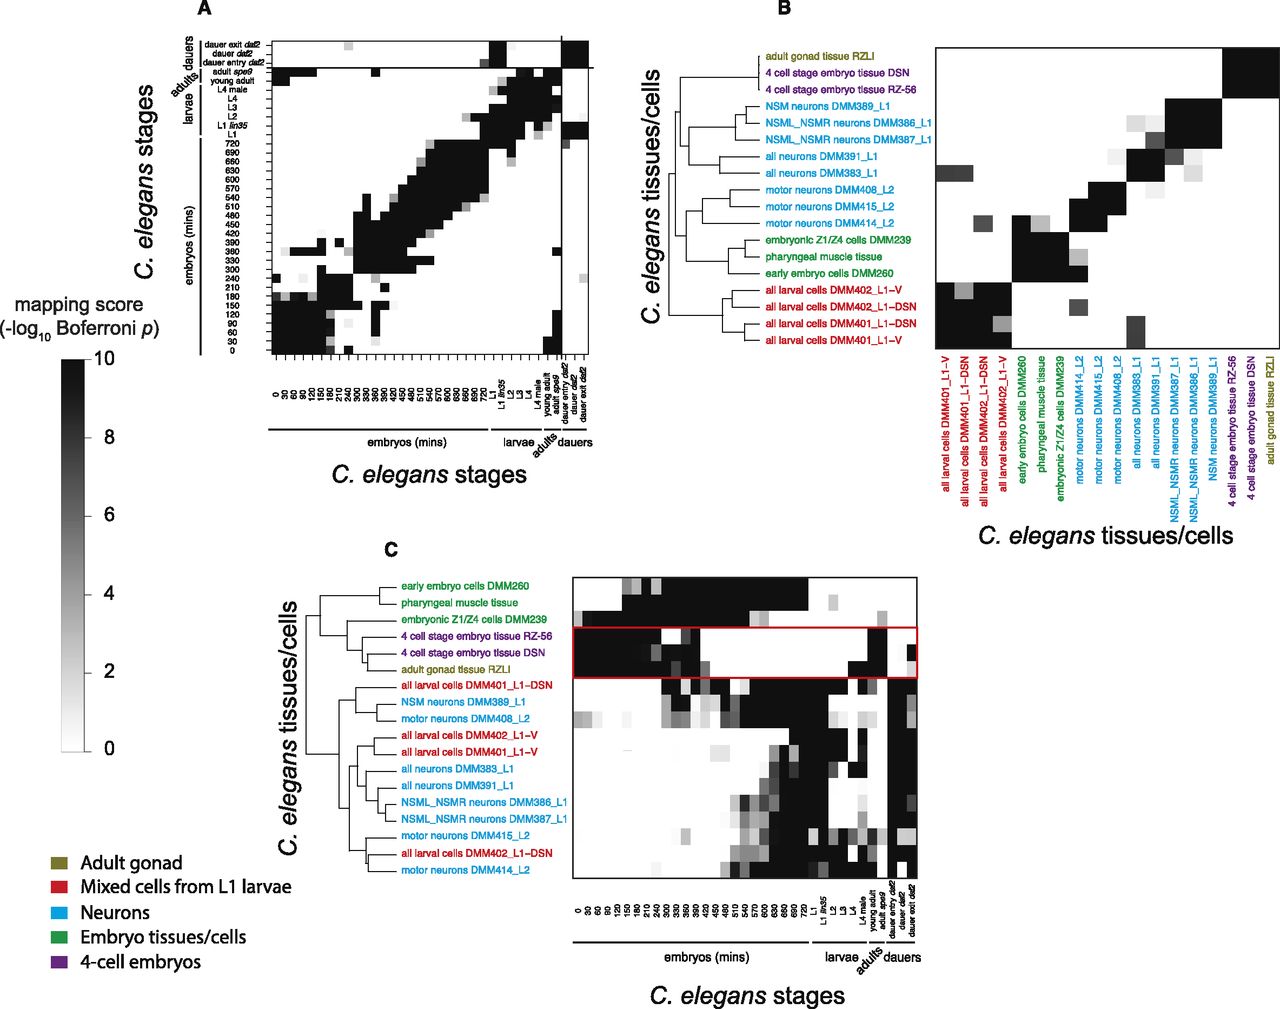
Comparison results of different developmental stages, tissues and dissected cells within C. elegans. Mapping scores shown in the heatmaps are –log10 transformed Bonferroni corrected P-values, which are calculated from the hypergeometric test in Figure 2A. (A) Stage comparison result, in which the three dauer stages are put on the right because they form an alternative developmental path in the worm life cycle. (B) Tissue/cell comparison result. (C) Comparison of developmental stages with tissues/cells, in which the red box marks the mappings of 4-cell embryos and adult gonad tissues to both embryonic and adult stages. Hierarchical clustering was applied to order the tissues/cells in B and C. Tissues and cells with similar origins are marked with the same color. For detailed information on the stage/tissue/cell labels, please refer to Supplemental Table S2.


