
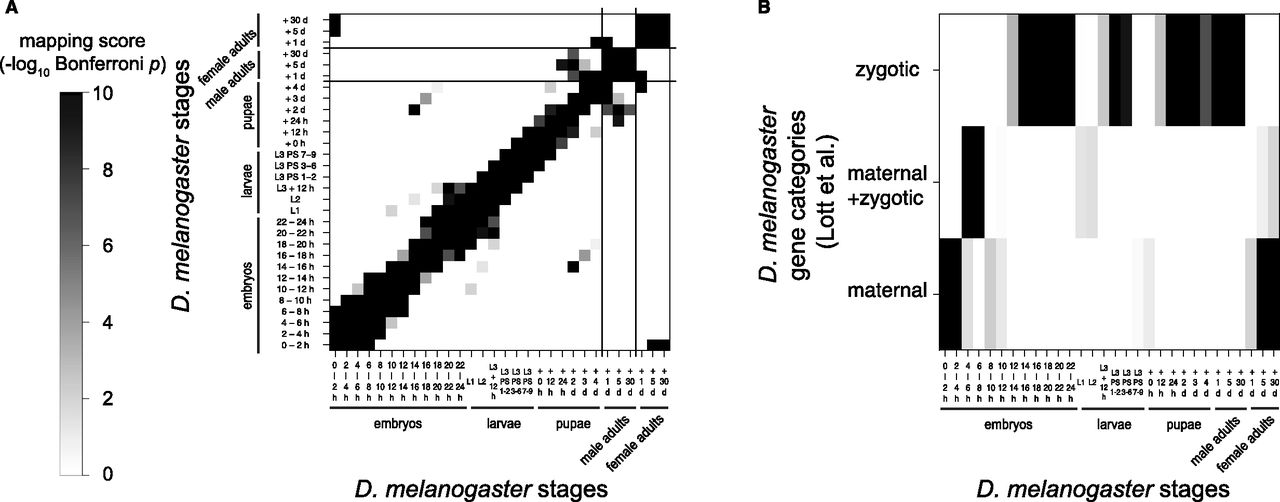
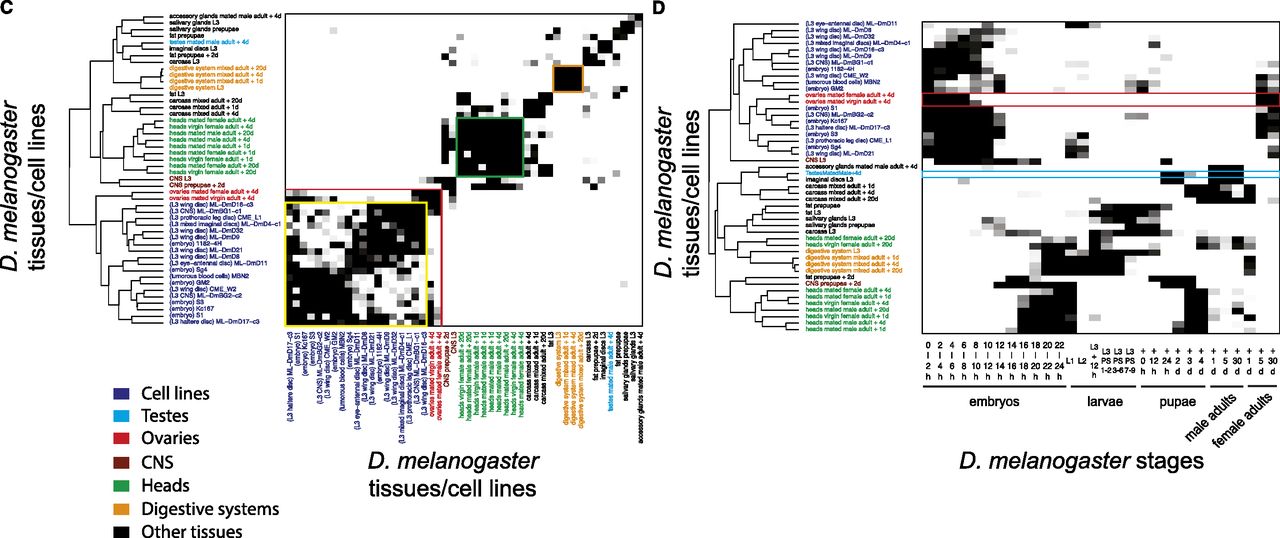
Comparison results of different developmental stages, tissues, and cell lines within D. melanogaster. More significant mapping scores are shown in darker color, corresponding to the scale showing –log10 transformed Bonferroni corrected P-values, which are calculated from the hypergeometric test in Figure 2A. (A) Stage comparison result. All are from mixed organisms with the exception that adults are separated into male and female that have the same three developmental time points (1, 5, and 30 d after eclosion). (B) Comparison of developmental stages with the three gene categories (maternal, maternal/zygotic, and zygotic) defined in Lott et al. (2011). (C) Tissue/cell line comparison result. The grouping of cell lines (yellow box), the mapping of cell lines and ovary tissues (red box), the grouping of head tissues (green box), and the grouping of digestive system tissues (orange box) are highlighted. (D) Comparison of developmental stages with tissues/cell lines, in which the red box marks the mapping of ovary tissues to early embryonic and female adult stages, and the cyan box marks the mapping of testes tissues to pupa and male adult stages. Hierarchical clustering was applied to order the tissues/cell lines in C and D. Tissues from similar organs and cell lines are marked with colors. For detailed information on the stage, tissue, and cell labels, please refer to Supplemental Table S2. Mapping score as in A and B.


