
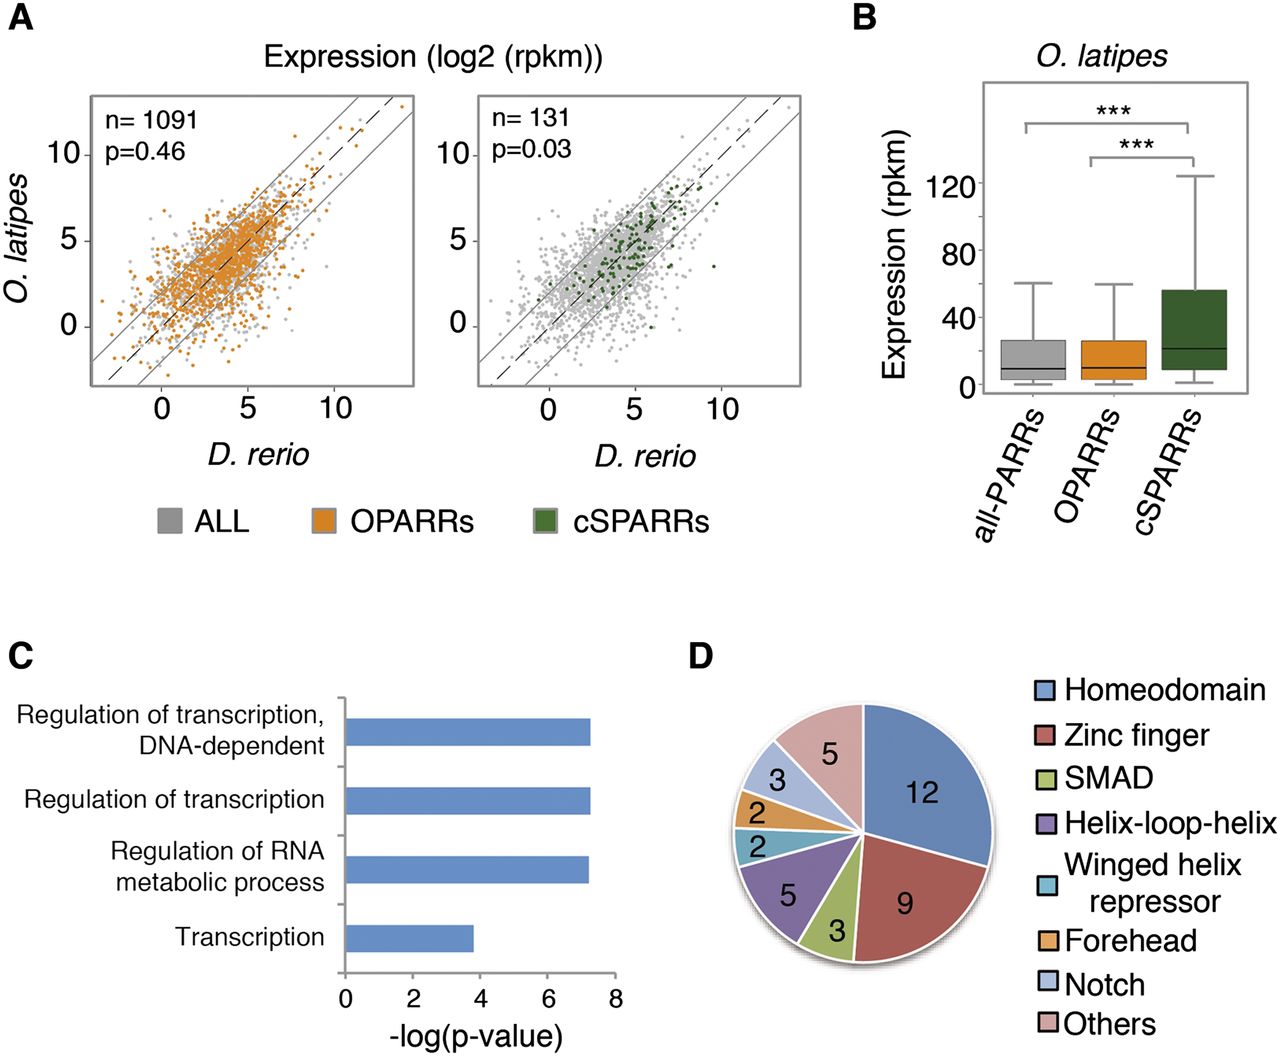
Integration of genome-wide epigenetic and expression data. (A) Comparison of zebrafish and medaka expression levels (log2 RPKM) for genes associated with OPARR (orange) and cSPARR (green) regions, as identified in medaka. These genes are plotted over the total number of genes associated with H3K27ac regions identified in medaka (gray). The number of genes included in each group is indicated in the upper left corner. Only genes with CPM > 1 are plotted. Note that genes associated with cSPARRs are significantly enriched in nondifferentially expressed transcripts (P = 0.46 and P = 0.03 for OPARRs and cSPARRs, respectively; hypergeometric test). (B) Box plot indicating the average expression levels (RPKM) of genes associated with cSPARR, OPARR, and all H3K27ac regions identified in medaka. (***) P < 0.001 (Wilcoxon rank sum test). (C) Gene ontology analysis of the total number of genes associated with cSPARRs. Significant biological process categories (P < 0.05) revealed that genes associated with cSPARRs are involved mainly in transcriptional regulation. (D) Representative InterPro domains present in transcription factors identified within the total collection of genes associated with cSPARRs. Numbers inside the chart indicate the number of genes present in each category.


