
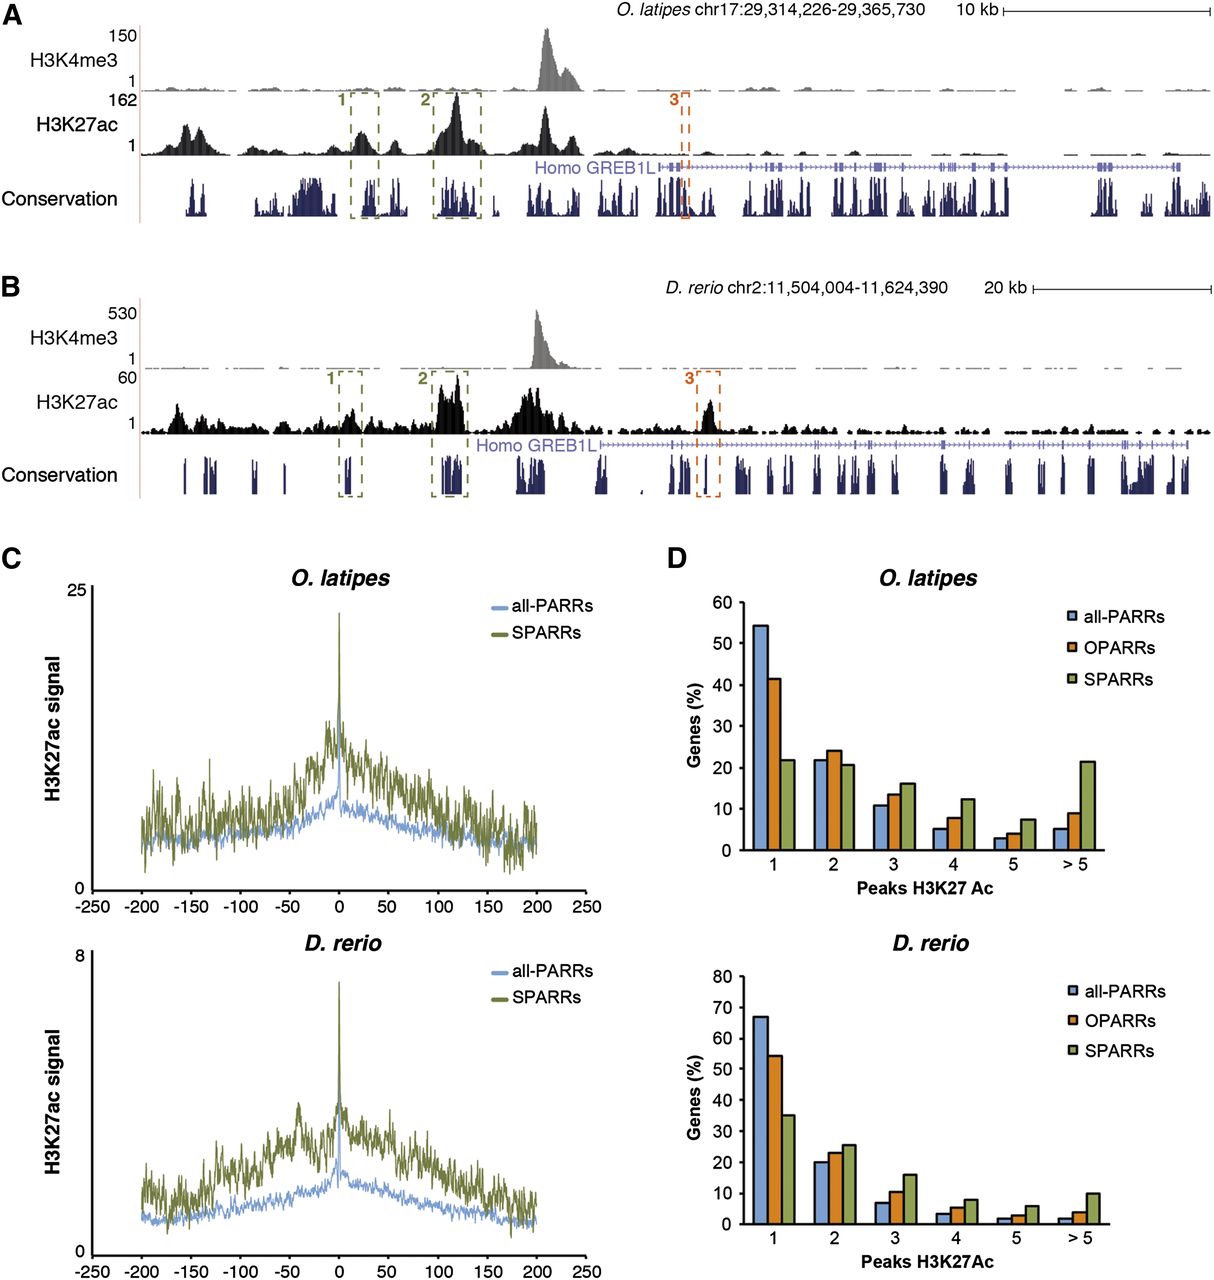
Analysis of the regulatory landscape of phylotypic genes associated with SPARRs and OPARRs. (A,B) Two examples of SPARR (1, 2) and one of OPARR (3) in the medaka genome (A) and their orthologous regions in zebrafish (B) are shown. (C) Average profiles of H3K27ac signal covering a 400-kb landscape for genes associated with all-PARRs (blue line) and SPARRs (green line) in both species: medaka and zebrafish (upper and lower panels, respectively). The average of reads in each bin of 200 bp is represented in log scale on the x-axis. The y-axis shows the position around the gene TSS, in kb. (D) Frequency distribution of orthologous genes (in percent) associated with either all H3K27ac peaks (all-PARRs), OPARRs, or SPARRs, according to the number of H3K27ac regulatory regions included in their vicinity; medaka and zebrafish (upper and lower panels, respectively).


