
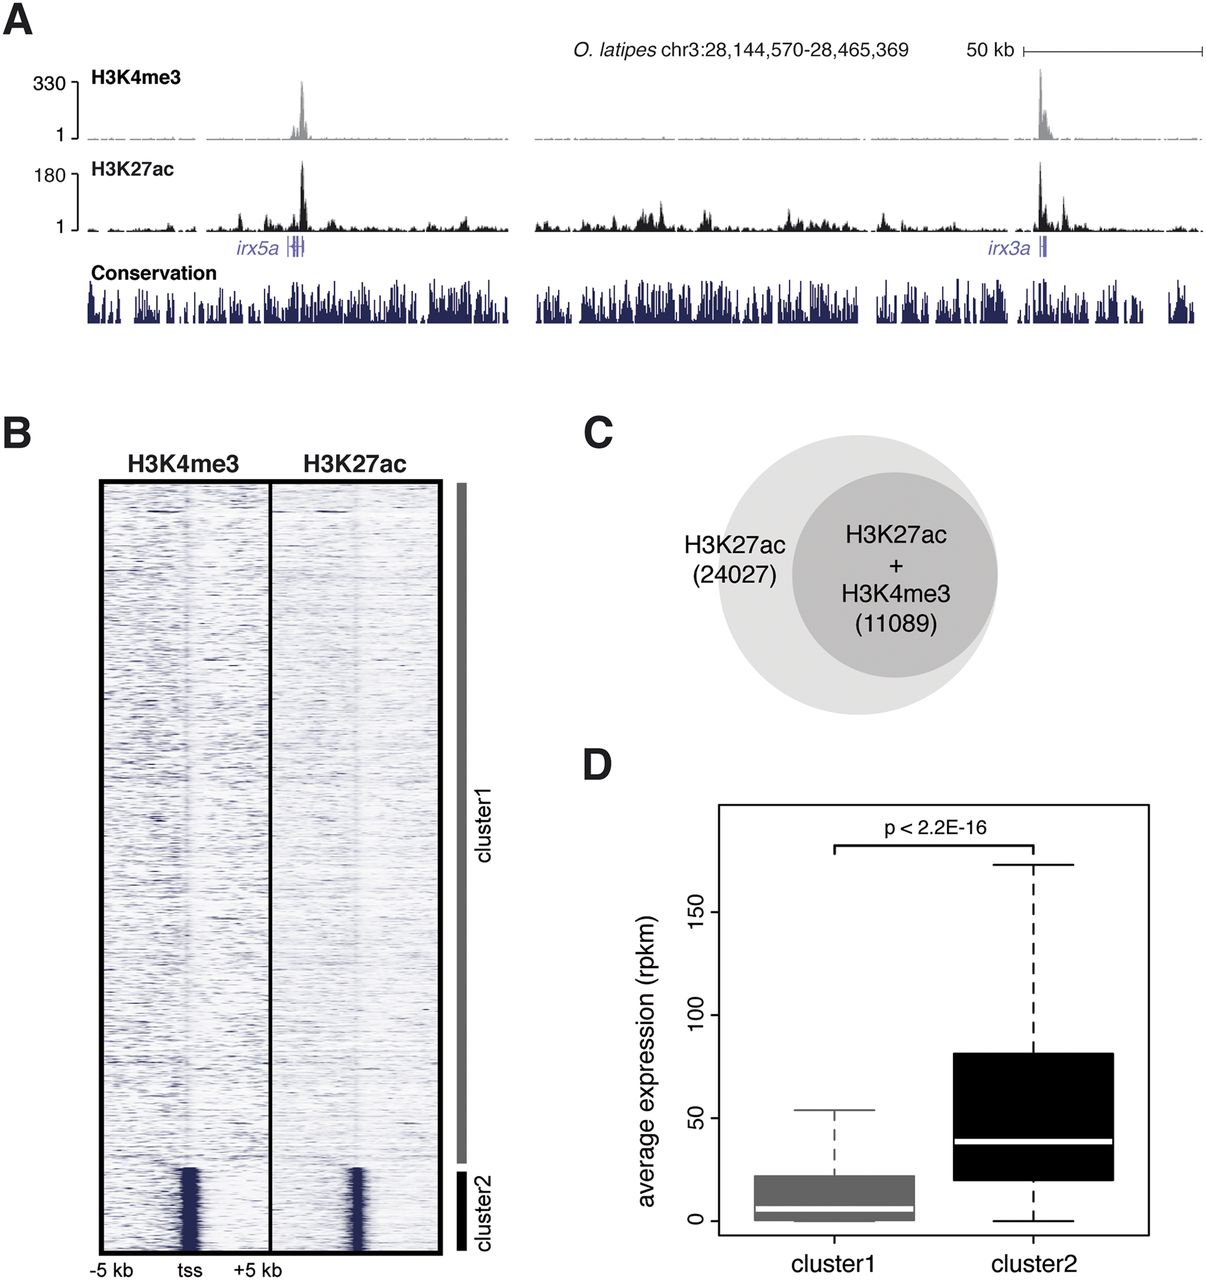
Characterization of epigenetic marks in stage 24 (44 hpf) medaka embryos. (A) UCSC Genome Browser view of H3K4me3 and H3K27ac tracks obtained from medaka ChIP-seq data. As previously described, both epigenomic marks cover the promoter regions of active genes. (B) K-means clustering (k = 2) of H3K4me3 and H3K27ac signals in ±5 kb around the TSS of all the genes annotated in the medaka genome. Cluster2 is enriched in both signals around promoters. (C) Venn diagram showing the fraction of H3K27ac regions overlapping with H3K4me3 regions (promoters). (D) Average expression (in RPKM) of genes grouped in clusters in B. Cluster2 genes show an average expression level higher than genes from Cluster1.


