
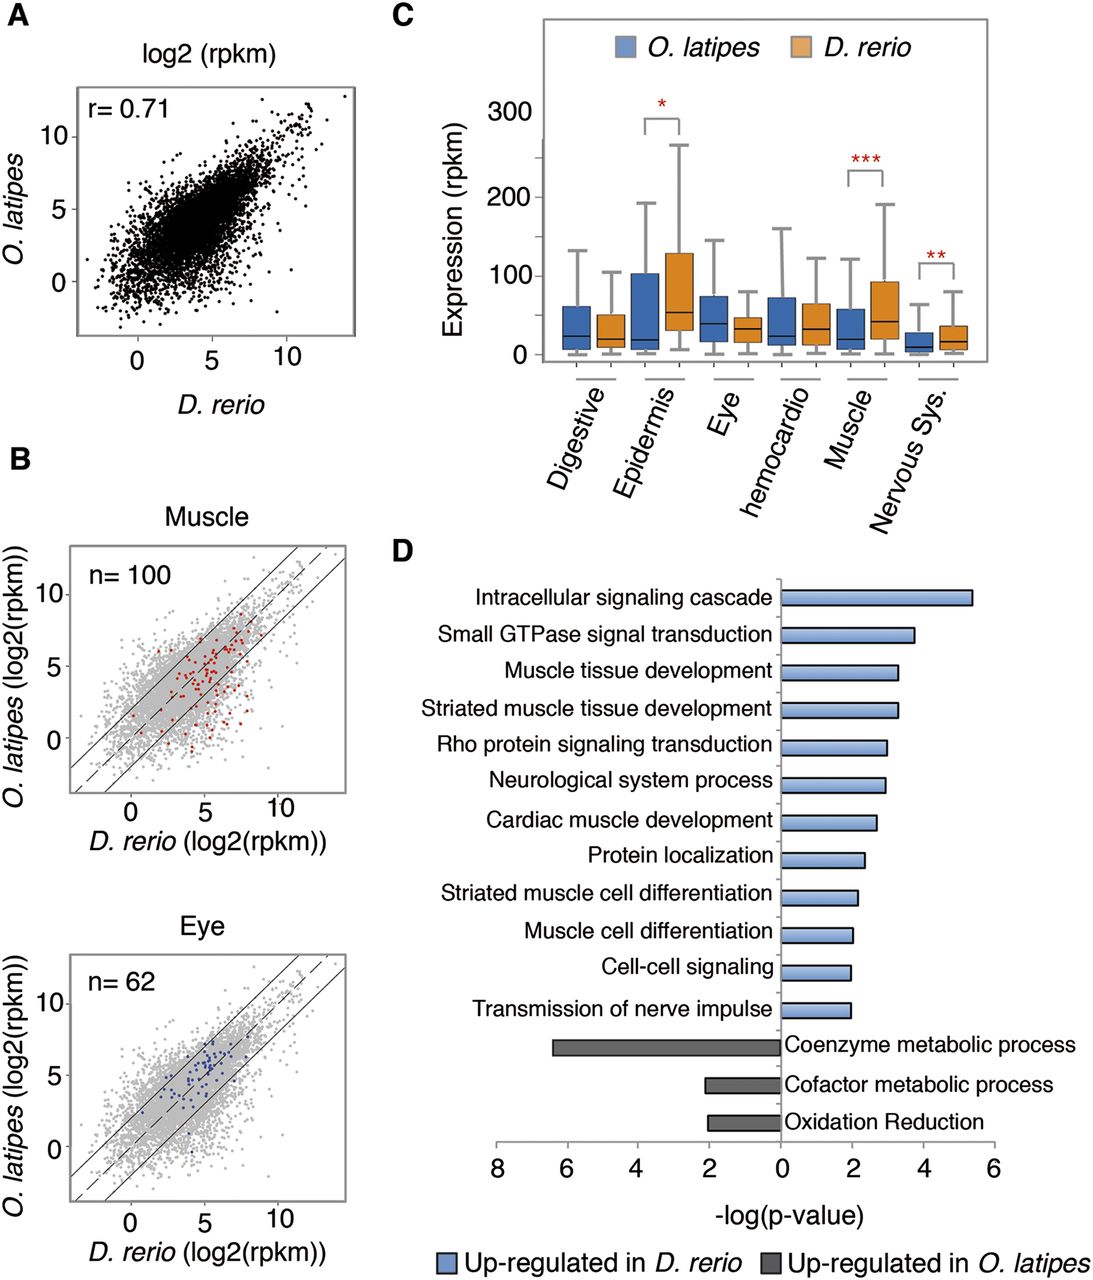
Comparison of expression levels between zebrafish and medaka at the phylotypic stage. (A) Correlation plot of zebrafish and medaka expression levels of the 7118 orthologs with expression higher than 1 count per million reads (CPM). The Pearson correlation coefficient (r) is indicated at the upper left corner. (B) Genes expressed in muscles (red) or the eye (blue), according to ZFIN annotations, are drawn over the total number of orthologous genes (gray). Each point represents the expression level of a given gene (log2 RPKM) in both species. Continuous black lines mark a fourfold change in expression. (C) Comparison of the expression levels in different tissues in the two species mentioned above. Bottom and top of boxes indicate 25th and 75th percentiles, respectively, and lines in the boxes indicate medians. Whiskers indicate the lowest and the highest data points within 1.5× interquartile range from the box. (*) P < 0.05, (**) P < 0.01, (***) P < 0.001 (Wilcoxon rank sum test). See also Supplemental Figure S2. (D) Gene ontology categories most significantly overrepresented in differentially expressed genes sorted by P-value. (Blue) Categories up-regulated in zebrafish; (gray) categories up-regulated in medaka.


